After a significant price increase to a new all-time high on Wednesday, October 20, the crypto reserve currency corrected back below USD 60,000 in the last few days of trading. Dominance also has to give up.
Bitcoin (BTC): Corrective move could lead BTC to $ 55,817
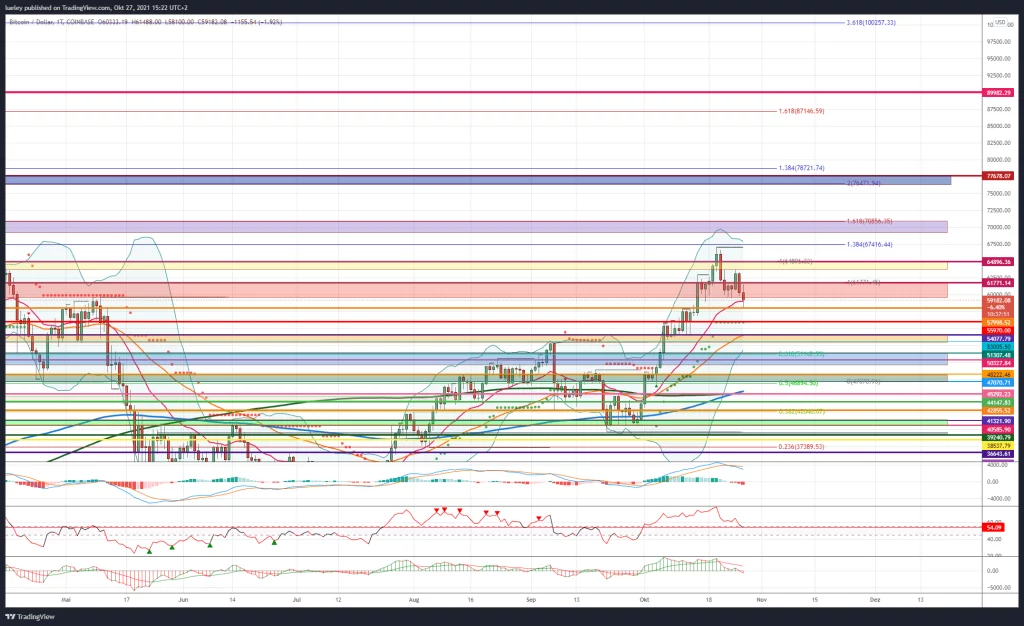
BTC rate : 59,182 USD (previous week: 65,972 USD)
Resistances / Targets: $ 59,470, $ 61,771, $ 64,896, $ 67,000, $ 67,416, $ 69,660, $ 70,856, $ 76,472, $ 77,678, $ 85,563, $ 87,090, $ 89,982, $ 100,259, $ 114,961
Supports: USD 57,998, USD 55,817, USD 54,077, USD 53,005, USD 51,307, USD 50,325, USD 49,555, USD 48,222, USD 47,070, USD 45,292, USD 42,855, USD 40,585, USD 39,240,
Price analysis based on the value pair BTC / USD on Coinbase
The crypto market can look back on an eventful week. Bitcoin hit a new all-time high of USD 66,999 last Wednesday, October 20, before increased profit-taking began in the following days. As mentioned in the last analysis, the bulls failed to stabilize the price above the previous all-time high of USD 64,896. The hoped-for positive effect of the introduction of the first two Bitcoin futures ETFs in the USA seems to have vanished for the time being. Starting from the new high, the key crypto currency lost around 13 percent of its value.
Another reason for today’s price correction up to the support at USD 57,998 could be the settlement of the Bitcoin futures next Friday. The open interest, ie the amount of open “bets” on the future price development, is also at an all-time high. In particular, the number of futures traded on the US futures exchange CME increased significantly. This development is primarily due to the launch of ETFs. However, as long as Bitcoin can stabilize above USD 55,817, the current corrective movement for the bulls can still be assessed as unproblematic.
Bullish scenario (Bitcoin price)
The Bitcoin course has clearly had to give up in the last few days. On Wednesday, Bitcoin fell to the first relevant support at USD 57,988, but can currently fight its way back above USD 59,000. As long as the Bitcoin bulls can keep the rate of the crypto key currency above USD 55,817 per day’s closing price and also recapture the resistance at USD 59,470 and USD 61,771, another attack towards USD 64,896 should be planned in the short term. If the buyer succeeds in breaking this resistance, the all-time high of USD 67,000 will come back into focus. If a new high can subsequently be reached and the 138 Fibonacci extension at USD 67,416 can be broken, a direct attack on USD 69,660 and the resistance at USD 70,856 can be expected.
The 161 Fibonacci extension at USD 70,856 is to be seen in the short term as the maximum price target for the coming trading week. If the BTC price does not rebound dynamically to the south here, a subsequent increase up to the target range of this trend movement between USD 76,472 and USD 77,678 is likely. If investor sentiment remains bullish until the end of the year, Bitcoin could penetrate into the higher-level target zone between USD 87,090 and USD 89,982. In perspective, Bitcoin could also march through to the 361 Fibonacci extension at USD 100,259. Although increased profit-taking is to be expected in the area of this milestone, the chance of reaching the medium-term target price of 114,961 USD (461 Fibonacci extension) would still be good.
Bearish scenario (Bitcoin price)
The bears used the last straw and countered the bull outbreak with a significant sell-off. Now the seller side must do everything possible to stabilize the Bitcoin price below the resistance at USD 64,896. A first important step in this direction was successfully taken with today’s sell-off back to support at USD 57,998. Now it is important to keep the BTC rate below its EMA20 (red) at USD 59,031 at the daily closing rate. The fact that the MACD indicator has now generated a sell signal plays into the hands of the seller. If the support at USD 57,998 is pulverized, an initial directional decision will be made in the USD 55,817 area.
Here the supertrend runs in the daily chart, a strong support. If Bitcoin breaches this support level at the daily closing price under sustained selling pressure, this would be another bearish indicator. Then the orange support area between USD 54,077 and USD 53,005 moves into the focus of investors. The EMA50 (orange) is currently also running in this zone. The cops will have to prove their purchasing power here. If, on the other hand, the Bitcoin price does not stabilize in this support zone, the correction extends to at least USD 49,555.
Directional decision threatens
A relapse to $ 48,222 is more likely. A directional decision can be expected in the coming months. If Bitcoin falls back below this strong support level, the chart for the bulls deteriorates significantly. If the support at USD 47,070 is then dynamically undershot, the cross support from MA200 (green) and EMA200 (blue) is retested at USD 45,292. If the bulls do not come back on the floor here either, a correction widening to USD 42,855 or even USD 40,585 is likely. The bears will then do everything in their power to undercut USD 40,585 and target the historical low of USD 39,240. Currently, the 39.240 level represents the maximum bearish price target for the coming trading months. As long as the key support at 48.
Bitcoin dominance: Correction after a 15 percent increase in dominance
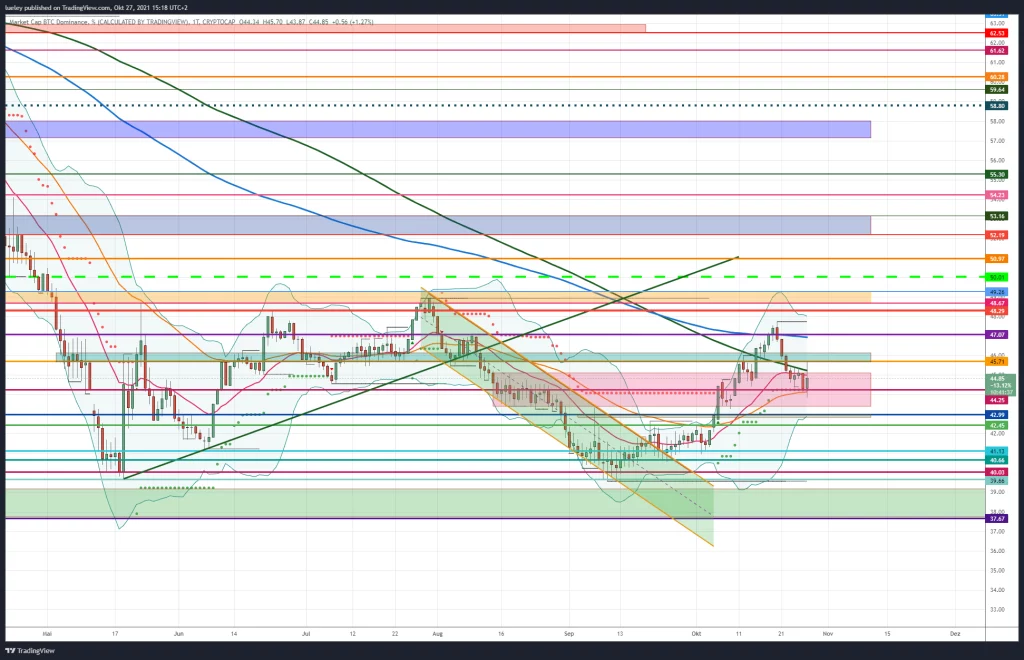
Bitcoin dominance on the basis of values of Cryptocap shown
After 14 days of the increase in Bitcoin dominance to a new high of 47.75 percentage points, the BTC dominance corrected back to the cross-support from Supertrend and EMA50 (orange) at 44.25 percent. As a result, the market dominance of the crypto reserve currency did not succeed in overcoming the EMA200 (blue) for the time being. Bitcoin’s price correction also consolidated its market dominance and resulted in significantly higher prices for many altcoins.
BTC Dominance: Bullish Scenario
The correction of the last few days of trading led the BTC dominance to the important support in the range between 44.54 percent and 44.25 percentage points. The dominance is currently stabilizing slightly, but is again within the red box at 44.85 percent. Bitcoin dominance is thus again valued below its moving average lines MA200 (green) and EMA20 (red). Only when these two resistance lines are recaptured and in particular the daily high at 45.71 percent is recaptured, a new attack in the direction of 47.07 percent should be planned. As already mentioned in the previous week’s analysis, a sustainable stabilization above the 47.07 percent is required. If the BTC dominance breaks this price mark and thus rises sustainably above the EMA200 (blue), the zone moves into focus by 48.29 percent.
If this resist is also broken through dynamically, a march through to the orange resistance zone must be planned. The increase target between 48.67 percent and 49.26 percent will initially continue to function as the target for the current trend movement. If it is also possible to sustainably regain the high of July 30, 2021 in the coming weeks, the market dominance should target the range between 50.00 percent and 50.97 percent. Another bearish countermovement is to be planned here. If the Bitcoin price can continue to rise by the end of the year and rise towards USD 70,000 and above, a march into the gray resistance area between 52.19 percent and 53.16 percent is also conceivable.
BTC Dominance: Bearish Scenario
After reaching the EMA200, the BTC dominance showed the presumed corrective countermovement at 47.07 percent. At its peak, the dominance of Bitcoins corrected eight percentage points back to the key support from Supertrend and EMA50. The market dominance fell significantly, but can stabilize in the red box for the time being. Should the BTC dominance fall below the support at 44.25 percent at the daily closing price, the consolidation should expand to 44.00 percent or even below. If the BTC dominance subsequently slips back below the red support zone, a relapse of up to 42.45 percent should be planned.
If there is no reversal to the north here either and both supports are abandoned at the daily closing rate, the monthly low of 41.13 percentage points will once again be in the focus of investors. Here the Bitcoin bulls have to prove themselves in order not to have the BTC dominance corrected again towards 40.66 percent. Then the probability of retesting the area increases significantly by 40 percent. A renewed start to the annual low of 39.66 percent must also be considered. However, as long as the BTC dominance can stabilize above 42.45 percent, a relapse back to the annual low is not to be expected.
Bitcoin Predictions by Industry Experts
Bitcoin should reach $500,000 by 2030.Jeremy Liew – A partner at Lightspeed Venture Partners
Bitcoin’s market cap is expected to surpass gold’s then market cap which was $7.5 trillion.Mike Novogratz – A former hedge fund manager & crypto enthusiast
Bitcoin shall reach $1,000,000 in five to ten years times which means no sooner than 2022 but as delayed as 2027.Wences Casares – CEO & founder of Xapo
Bitcoin will reach $1,00,000 in the next 3 – 4 years and for the long run will reach the mark of $1 million in or by 2037.Chamath Palihapitiya – Co-owner of Golden State Warriors & founder of Social Capital
Bitcoin will continue to be appreciated by investors.Bloomberg’s Crypto Galaxy Index (BGCI) report
Bitcoin shall soar to $3,00,000 per bitcoin in the next five years.Adam Back – A cryptographer & crypto pioneer
The adoption of bitcoin by institutional investors has only begun, while for gold its adoption by institutional investors is very advanced. If this medium to longer-term thesis proves right, the price of gold would suffer from a structural flow headwind over the coming years.JPMorgan
Bitcoin Price Prediction 2021
According to TradingBeasts’ BTC price prediction, is likely to cross $70,797 by the end of 2021. Bitcoin will trade in the range of $48,000-$56,000 with the minimum & maximum BTC price respectively in the year 2021. As per the above chart, the technical indicators of the king of cryptocurrency also reflect the possibility of continual bullish rally. Moreover, The Bitcoin price surged more than 4% over the last 24 hours to hit a new all-time high of $62,839 ahead of Coinbase debut, as Coinbase is set to go public by April 14 and could be valued at as much as $100 billion.
Bitcoin Forecast for 2022 – 2023
Bitcoin price forecast for the year 2022 is predicted at $87,500 by TradingBeasts, given all other factors being stable and no emergency scenario will change. Bitcoin price is likely to trade around $60,000 and $70,000 for a minimum price and maximum price respectively in the year 2022.
As per our Bitcoin price prediction for 2023, BTC price will cross the bar of $96,000; and hold the market with a steady position. The lowest Bitcoin price will be around $65,000 and highest price will be above $82,000 in the year 2023.
Bitcoin Price Prediction for 2024
Bitcoin might start the year 2024 with an average price of $104,000; Bitcoin can trade around the price of $100,000 by the end of 2024. Bitcoin could trade with a min. price of $70,000 and a max. of $100,000 in 2024.
Bitcoin Prediction for 2025
Bitcoin price prediction 2025 seems to be the year of the bull with Bitcoin at an all-time high of $100,000, to as much as $400,000. It could be the year of Bitcoin.
It is very much likely that Bitcoin will double in price, but it is also possible it may not. This is merely for the reason that it is not supported by any specific regulatory authority or regime. Some could have made thousands of dollars in Bitcoin after an early $100 investment, but when the recent charts started to look a lot like a stock market bubble, many probably took their money and ran.
Disclaimer: The price estimates presented on this page do not constitute buy or sell recommendations. They are only an assessment of the analyst.