The Bitcoin course rushed to a new low for the year after new bad news about Genesis and Grayscale.
It was only a few weeks ago that the US trading platform FTX disappeared from the scene in a spectacular way, and the crypto market is already facing the next, possibly even larger, payment default. The next trouble spots are already emerging around the Digital Currency Group (DGC) and its subsidiaries, the central lending platform Genesis and the world’s largest Bitcoin fund Grayscale .After a sideways movement since a new low for the year was formed on November 9th, the price of the key crypto currency slipped slightly below the previous low for the year to USD 15,461 in the evening hours yesterday, but was able to recover somewhat this Tuesday afternoon (November 22nd) and estimated at the time of this analysis at 16,177 US dollars in the area of the first relevant price mark of the previous weeks.
Also Read: How to fit an offer in 68 characters: a detailed guide to mobile push notifications
In addition to the latest risks surrounding Grayscale and Co., the flood of numbers in the classic financial market on Wednesday (November 23) should ensure sustained high volatility.
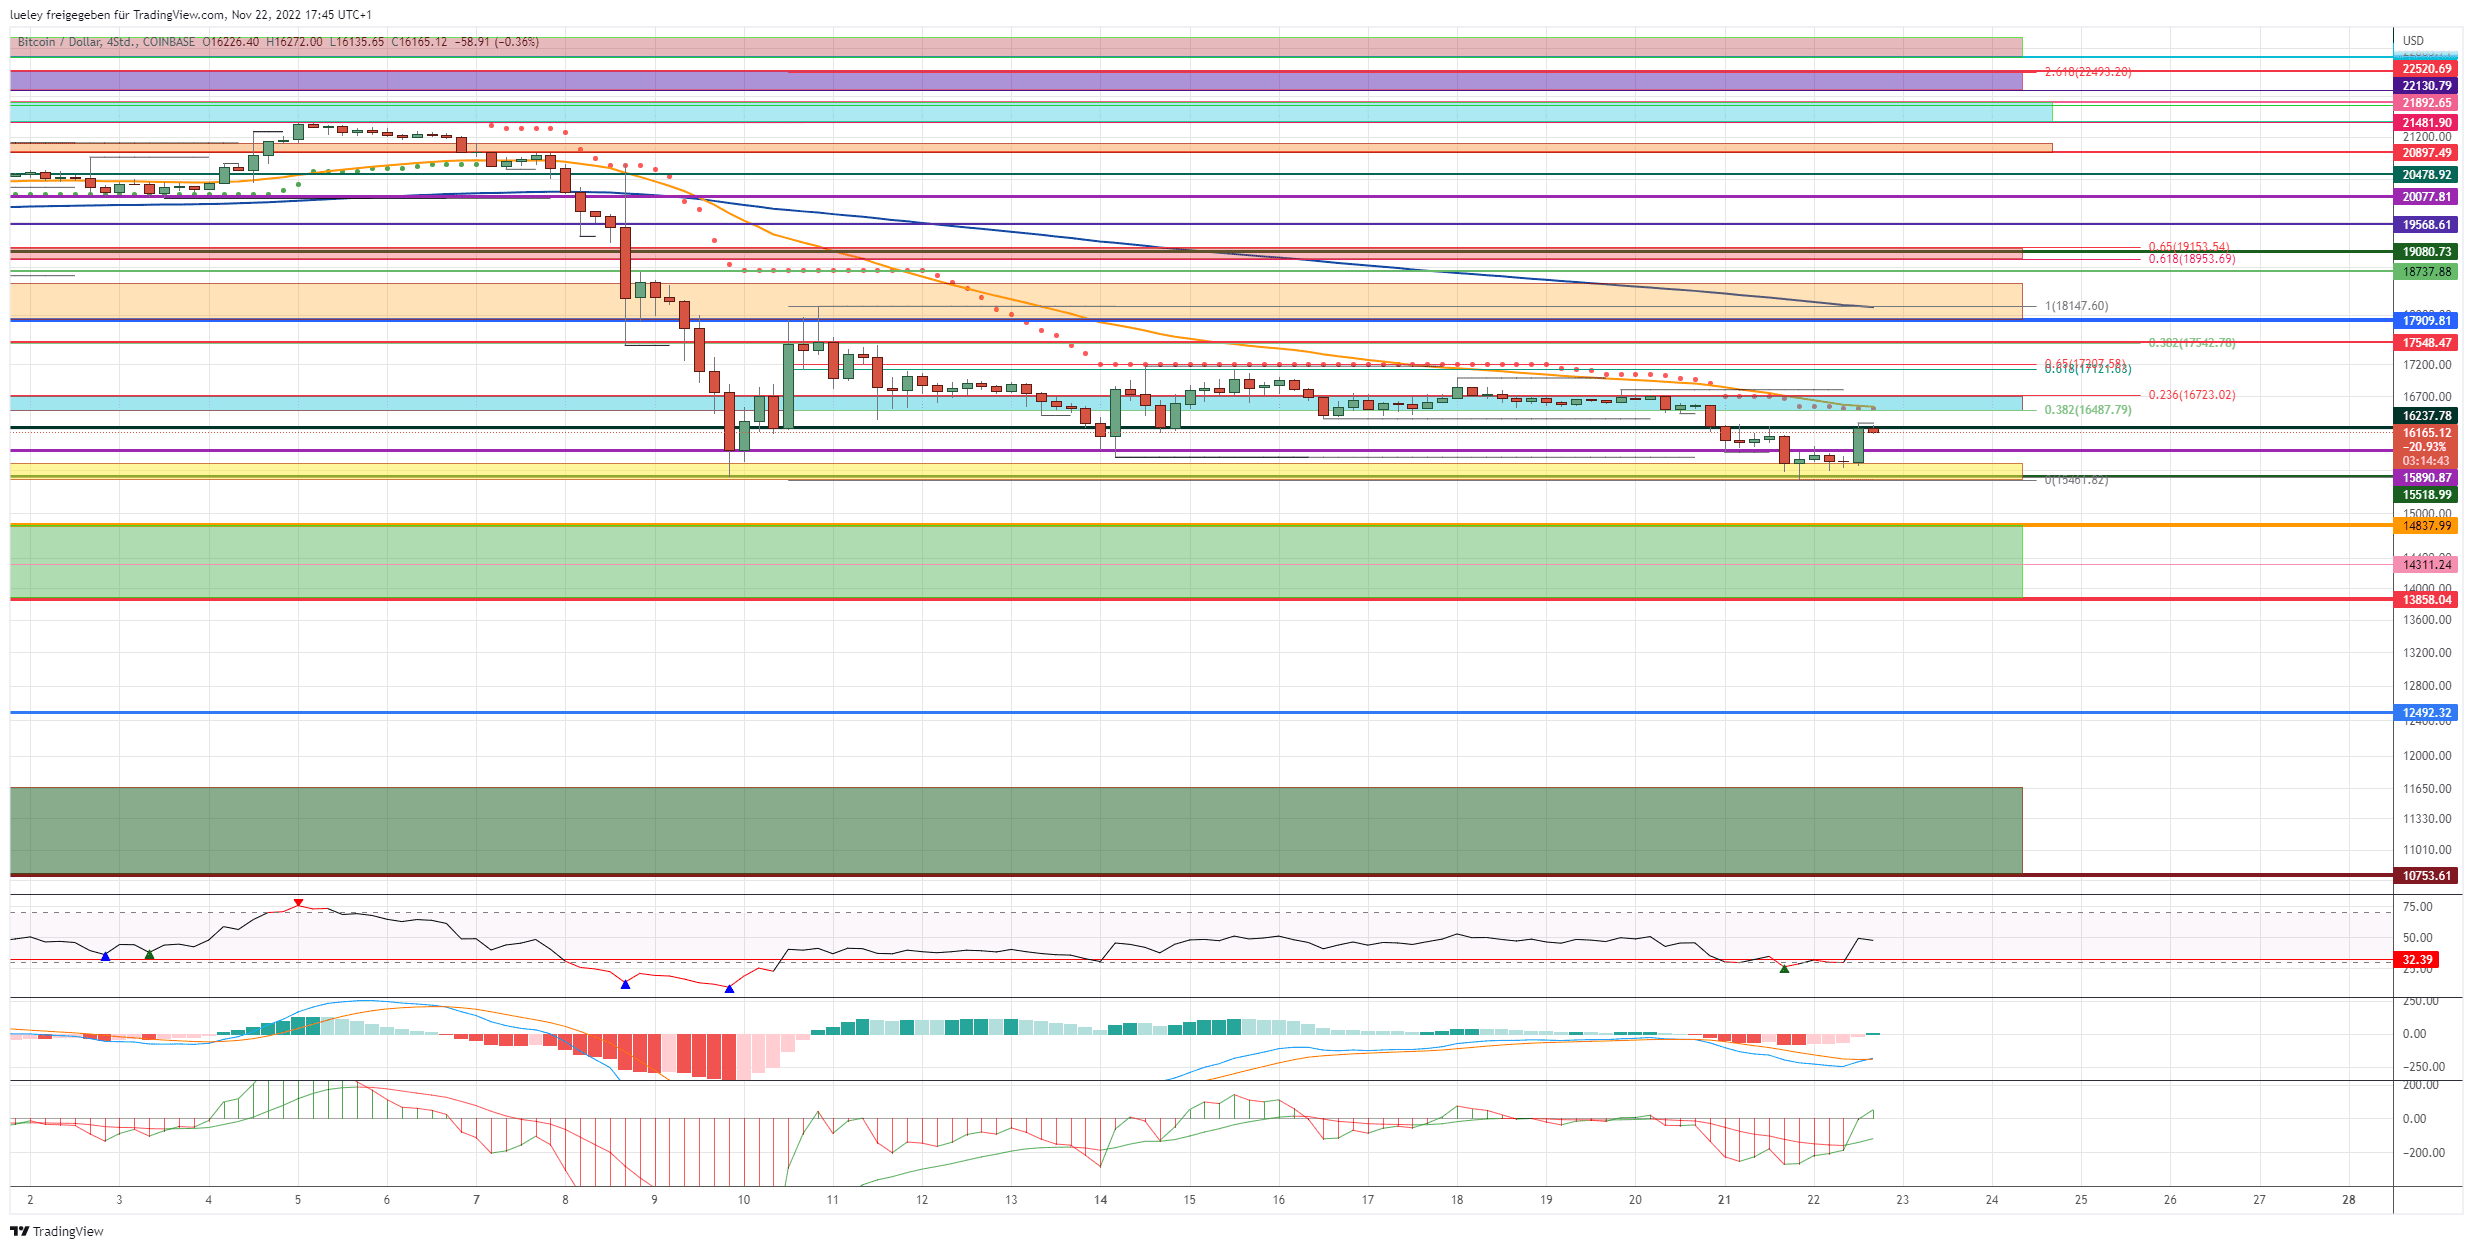
Bitcoin is still resisting the sell-off
Despite the sell-off, the buyer camp was able to turn away for the time being despite the continuing bad news. However, this could change at any time with new details about Genesis’ payment difficulties and increasing questions about the condition of the umbrella company DCG. A first sign would be a price stabilization above USD 16,237. However, this slightly optimistic scenario would be shattered immediately if the Bitcoin price fell again in the direction of the yellow support zone between USD 15,710 and yesterday’s low at USD 15,461 and subsequently dynamically undercut this area as well.
- Bullish course targets : 16,478/16,711 USD, 17.121/17.207 USD, 17,523 USD, $ 18,147, $ 18,946/19,146 USD, $ 19,881, 20,478 USD, 20.897/21.481/ USD
Bullish price targets for the next seven trading days
For the buyer side it is anything but a bullish price festival at the moment. Almost every day, new price-damaging news about insolvencies, hacks and tightened regulatory measures hit the crypto space. In view of this difficult overall situation, the bulls can attest to a certain resilience. If it is possible to stabilize the BTC price again quickly and sustainably above the price mark of USD 16,237, the buyer side must immediately try to recapture the multiple resistance zone between USD 16,487 and USD 16,709 in the same breath. There is a whole bunch of resistances here. In addition to the 38 Fibonacci retracement of the last price movement, the super trend in the 4-hour chart, the EMA50 (orange) and the higher-level 23 Fibonacci retracement, this area is also a horizontal resist zone that has been hard fought for recently. In the first attempt, the buyer camp is likely to fail here and Bitcoin will occasionally fall back towards USD 16,237. A lot could also depend on tomorrow’s round of data in the USA. Breaks throughBitcoin price , supported by positive economic data, this strong resist area, the small golden pocket of the current trading movement between USD 17,121 and USD 17,207 comes into the focus of investors. The last historical high from November 14 can also be found here.
The technical price recovery could gain momentum
If the buy side can generate enough price momentum and also break through this area, the recovery extends directly to USD 17,523. In addition to the 38 Fibonacci retracement, the old low for the year at USD 17,548 can also be found here. First profit-taking must be planned for. If the key crypto currency recaptures this resistance without any significant setbacks, it should carry the BTC price right down to the lower edge of the orange resistance zone. The area between USD 17,909 and USD 18,530 has acted as a support area several times in the last 4 trading weeks, which is why it is now a resistance zone. In addition, the EMA200 (blue) runs at USD 18,147, which is why this area is to be considered a make-or-break zone. Should the bull camp then succeed in approaching and overcoming the old edge at USD 18,737, puts the overriding golden pocket of the movement between the yearly low and the monthly high of 5 November at USD 21,481 in the eyes of investors. The zone between USD 18,956 and USD 19,146 represents the first relevant price target for Bitcoin.
If the buyer side can also overcome this first important price target without any significant setbacks and thus recapture the point of control (POC) at USD 19,080, the BTC price should gain further upward momentum and start back above USD 19,568 towards USD 20,077 . In the short term, a subsequent bullish rise is not to be planned.
Stabilization above USD 20,000 would reduce selling pressure
Only when the zone around USD 20,077 can also be recaptured at the end of the day can the bulls hope for a subsequent rise towards the old sideways upper edge at USD 20,478. It remains to be seen whether this resist level will also be broken through without another price setback and will likely be largely determined by news about Genesis and Grayscale.
However, should the buyer side succeed in dynamically breaking through this resistance level in the medium term, the next target area between USD 20,897 and USD 21,083 will be activated. This means that the medium-term price target derived from the monthly high of USD 21,495 would be within reach.
With the large Golden Pocket between USD 21,509 and USD 21,819, there is also a powerful resistance zone here, which can currently be regarded as the maximum imaginable target mark.
- Bearish price targets: $17,494, $16,924, $16,201, $15,512, $14,837, $14,311, $13,858, $12,492, $11,689, $10,753
Bearish price targets for the next seven trading days
However, should Bitcoin run out of steam in the turquoise resist zone between USD 16,487 and USD 16,709 and the key crypto currency then falls back to the yellow support area, the probability of new lows for the year increases noticeably. A dynamic dip below yesterday’s low for the year would put the zone between USD 14,837 and USD 13,858 in the focus of investors. In the first attempt, a countermovement by the bulls should be planned. In particular, the lower edge of the green support area at 13,858 represents a massive support level, which is derived from the monthly chart. The bulls will definitely not let up here and will buy the BTC price back towards the USD 15,500 area at least in the first contacts. If, contrary to expectations, there is no sustained stabilization at this price mark in the coming weeks, and the lower edge of the support zone is also undercut dynamically, the sell-off will immediately expand towards USD 12,492. Bitcoin could only give way back to the green support zone between USD 11,659 and USD 10,753 in the medium term if this price mark were also abandoned in the long term. However, in view of several strong supports from the weekly and monthly charts, this is to be regarded as unlikely. Bitcoin could yield back to the green support zone between USD 11,659 and USD 10,753 in the medium term. However, in view of several strong supports from the weekly and monthly charts, this is to be regarded as unlikely. Bitcoin could yield back to the green support zone between USD 11,659 and USD 10,753 in the medium term. However, in view of several strong supports from the weekly and monthly charts, this is to be regarded as unlikely.