 Price Forecast, Cardano (ADA) Price Prediction 2023, Best time to buy ADA coin , where to buy ADA at best price)
The Cardano (ADA) course has been able to stabilize further in recent weeks, but a sustained liberation is a long time coming.
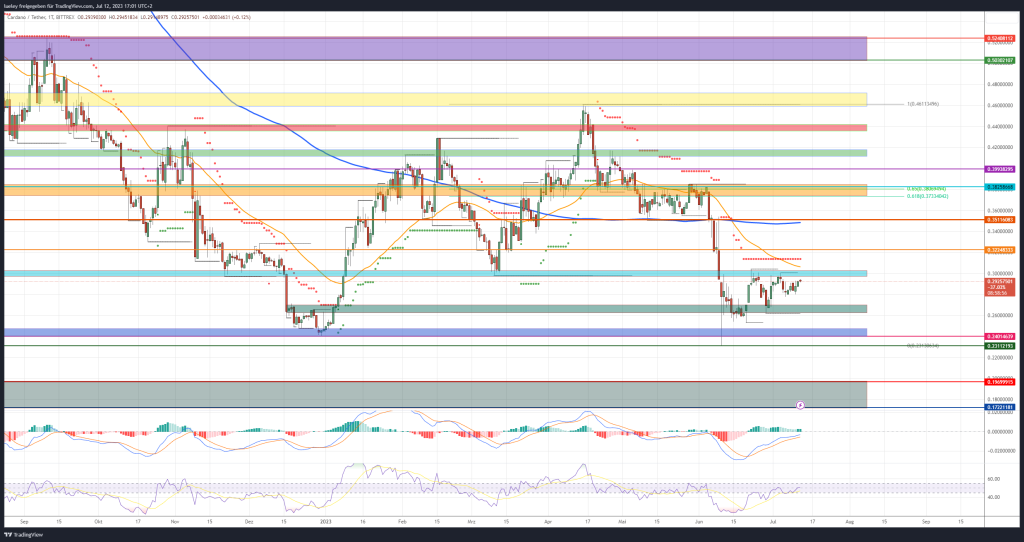
The Cardano price was able to recover a good 25 percent after the significant sell-off in the previous month, but at around USD 0.291 it is still below the first relevant resistance of USD 0.302. Although the blockchain upgrade was able to stabilize the ADA course , the overall trend is still bearish for the time being. The chart image only brightens for a short time with a sustained stabilization above the EMA50 (orange), which is currently not far from the turquoise resist area. Above all, a bullish trend reversal can only be spoken of when the resistance zone around 0.382 US dollars is recaptured.
Cardano: Bullish price targets for the next few weeks
Bullishes: $ 0.302 , $0.322, $ 0.351 , $ 0.373/$0.382 , $0.399, $0.413/$0.417, $0.435/$0.441, $0.459/$0.466, $ 0.478 , $ 0.503/ $
Cardano continues to struggle. Most recently, the course bounced off several times from the low of March 10th to the south. On the positive side, higher lows have formed in recent weeks. If the buyer side succeeds in dynamically recapturing the strong resistance at 0.302 US dollars and as a result the EMA50 and the supertrend are broken upwards, the 0.322 US dollar mark comes into view. If Bitcoin’s rally continues to gain momentum as Bitcoin makes new yearly highs , ADA could rally to the key $0.351 mark. In addition to the trailing edge from the beginning of June, the MA200 (blue) also runs here in the daily chart.
A trend reversal is only possible if this mark can be sustainably broken through. Cardano should then start up to the golden pocket of the last price movement between USD 0.373 and USD 0.382. This area represented the next important target zone for the coming weeks. Only if enough buying momentum arises and the last high from May 29th is also conceded, a new trend movement above the 0.399 US dollars in the direction of the green resist zone can be planned.
The intermediate high in the area between US$ 0.413 and US$ 0.417 then acts as the next resistance. This will decide whether a fresh run towards the April 19 stall line at $0.436 can be made. At this point at the latest, increased profit-taking should be planned. Should the buyer side also overcome this price level in the future, a march through to the high for the year at 0.462 US dollars is conceivable. Unchanged, this chart area acts as a maximum increase target for the coming time.
Cardano: Bearish price targets for the next few weeks
Bearish price targets: $0.270/0.262, $ 0.247/0.240 , $00.196, $0.172
As forecast in the last price analysis on June 7th , the bears caused a significant sell-off at Cardano just a few days later. The SEC lawsuit against Binance and Coinbase took effect. Despite a price recovery in the last few weeks, the sell side has so far been able to cap the ADA price in the turquoise resist area. As long as this area is not broken through to the upside, a price pullback to the support zone between US$ 0.270 and US$ 0.262 can be expected at any time. Here the buyer side has to put up resistance.
If the price does not stabilize here either and Cardano also gives up this support at the end of the day, the ADA price could fall again in the direction of the blue support area between USD 0.247 and USD 0.242. A spike to the low for the year at 0.231 US dollars must then also be planned for. This area also represents an attractive entry level for buyers. The formation of a double bottom would also be an interesting constellation from a technical point of view.
If, on the other hand, Bitcoin experiences a stronger setback in the coming months and the Altcoin sector comes under more pressure again, a sell-off into the gray zone between US$ 0.196 and US$ 0.172 cannot be completely ruled out.
Looking at the indicators
The RSI was able to recover recently, but with a value of 50 it is still trading in the neutral zone between 45 and 55 for the time being. The MACD indicator has generated a slight buy signal, but is still below the 0 line. Looking at the weekly chart, at least the RSI is showing an initial recovery, but is still trading below its neutral zone. The MACD also continues to trend significantly south. No fresh buying impulses can therefore be expected from the weekly chart in the short term.