Cryptocurrency enthusiasts and investors are always looking for promising investment opportunities, and Ripple’s XRP has been a subject of keen interest. In this blog post, we’ll delve into a detailed technical analysis to explore the potential for Ripple XRP to reach $2 in 2024.
XRP Price History
XRP, originally introduced in 2012 by the technology firm Ripple Labs under the name OpenCoin, underwent a name change in 2013. The primary objective of this cryptocurrency was to facilitate cross-border transactions with swift settlement at minimal costs.
Based on CoinMarketCap records, XRP commenced trading at an initial price of $0.005875 in 2013. After experiencing a brief bullish phase in November 2013, its value surged to $0.05238. Subsequently, a market downturn ensued, leading the coin’s price to predominantly hover below $0.01 until the second quarter of 2017, when it experienced a significant upturn, reaching $0.3532.
Following a period of consolidation, XRP achieved its all-time high (ATH) of $3.84 on January 4, 2018. However, the cryptocurrency entered a bear market, plunging to lows of $0.1432.
Moving Average of XRP – Ripple Price Forecast Jan 2024 (Charting at 4H)
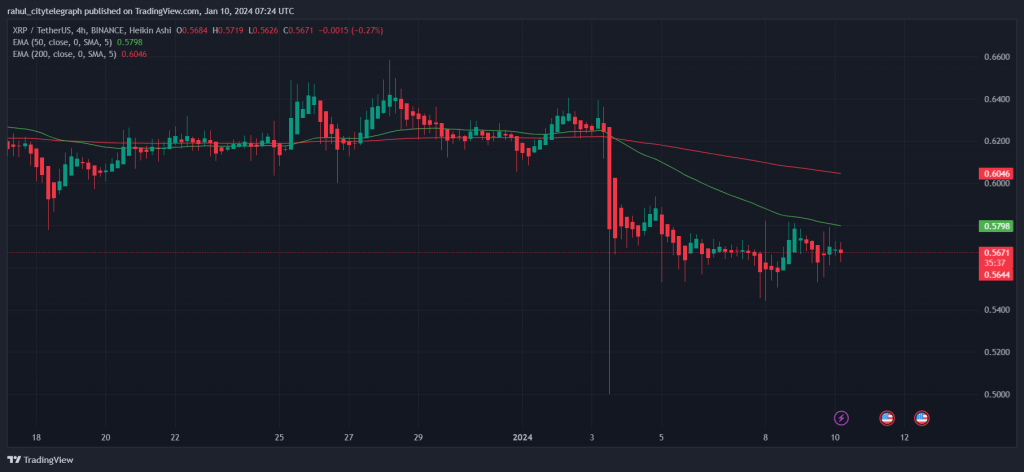
The chart shows Simple Moving Averages (SMA) with lengths 50 and 200 are employed. The chart displays SMA 50 as a green line and SMA 200 as a red line. In the context of Ripple coin’s technical analysis, it is observed that SMA 200 intersects SMA 50, indicating a significant downward movement in the price of Ripple.
Pivot, Resistance and Support Levels
Calculation For Trading:
Resistance Level (R3): 0.598
Resistance Level (R2): 0.588
Resistance Level (R1): 0.577
Pivot Point: 0.567
Support Level (S1): 0.557
Support Level (S2): 0.546
Support Level (S3): 0.536
MACD of XRP – Ripple Price Forecast Jan 2024 (Charting at 4H)
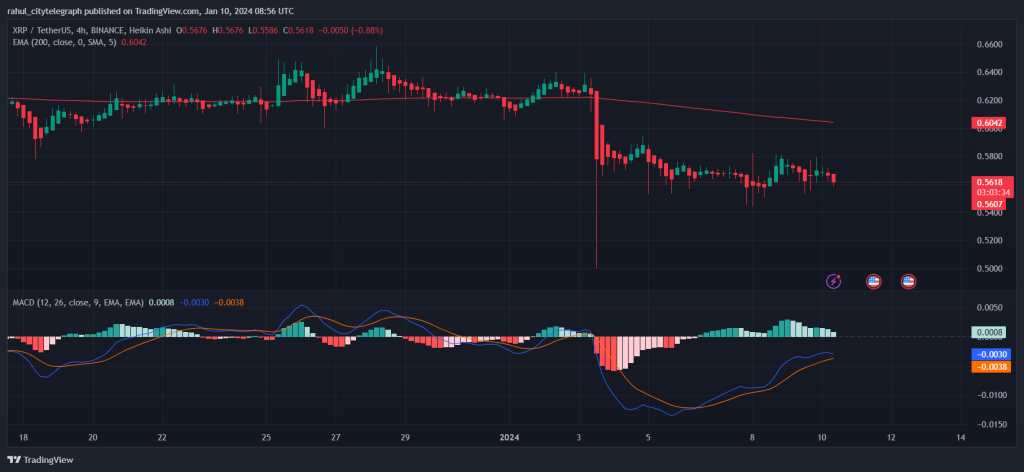
Upon analyzing the Moving Average Convergence Divergence (MACD) chart for Ripple, it is evident that the MACD orange line is descending below the signal blue line. This configuration implies a bearish trend in the Ripple coin price, suggesting a potential decrease in its value according to the insights derived from the MACD analysis.
Also Read: Solana Price Prediction: Will SOL Reach 300$ in 2024 – Technical Analysis
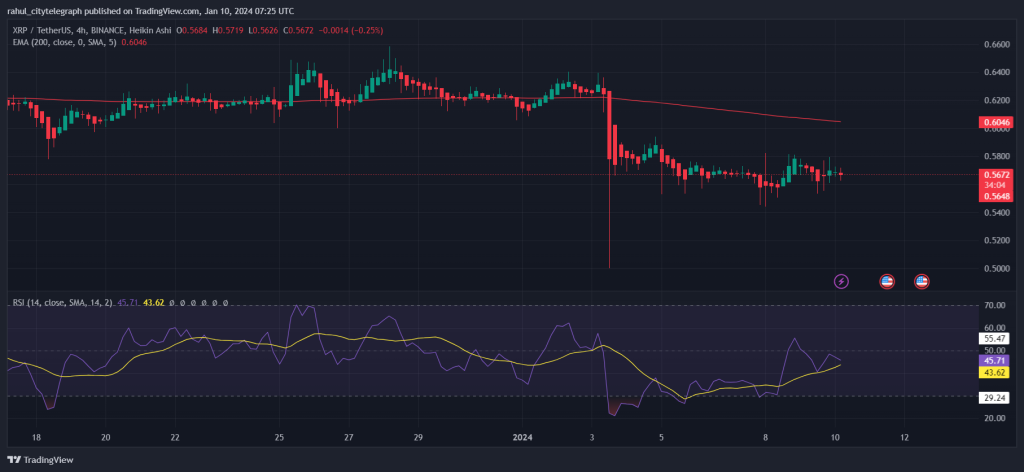
Relative Strength Index (RSI) of XRP – Ripple Price Forecast Jan 2024 (Charting at 4H)
Potential Highs and Lows of XRP Price

For more content like this do follow us on Instagram, Facebook and X
Disclaimer:
The information herein is purely for general informational purposes, not constituting financial, investment, or professional advice. Reliant on publicly available information and personal interpretations, its accuracy, completeness, or relevance isn’t assured. Readers are strongly urged to perform individual research before financial decisions, given the risks involved. Past performance doesn’t predict future results, and personalized advice from a qualified financial professional is recommended.
The author and platform disclaim responsibility for losses resulting from reliance on this content. Financial markets fluctuate, and investments can rise or fall. Opinions expressed are solely the author’s and may not reflect the platform’s views. Trading carries inherent risks; users should exercise caution, assess risk tolerance, and seek professional advice. This article doesn’t endorse specific actions regarding financial instruments.
Accessing and reading this article implies agreement with this disclaimer. The author and platform aren’t liable for direct or indirect consequences of using or relying on the provided financial information.