The Bitcoin price chart for the last 24 hours indicates a current value of $41,471.45, reflecting a 0.31% decrease from the previous day. The chart employs Heikin-Ashi candlesticks, designed to reveal market trends more clearly by averaging open, close, high, and low prices over time. This smoothing effect aids in recognizing the overall trend direction.
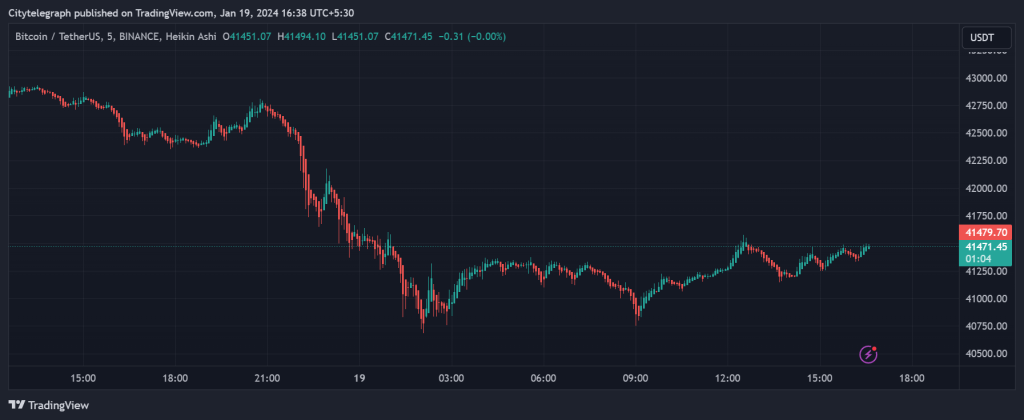
In the provided chart, the predominance of red Heikin-Ashi candlesticks suggests a downward trend in Bitcoin’s price. However, a notable long green candle at the chart’s bottom hints at potential buying support in that range.
Discussing support and resistance, support signifies a level where an asset’s decline may halt and a rise commence, while resistance is a level where a rise might stop and a fall begin.
Examining the chart, there’s apparent support around $41,000, evidenced by Bitcoin bouncing off that level earlier. Resistance is observed at approximately $42,500, as the price has struggled to surpass this point in recent days.
It’s crucial to recognize that support and resistance levels aren’t foolproof predictions but historical zones where the price has shown patterns. Future behavior is uncertain, and these levels may not always dictate price movements.