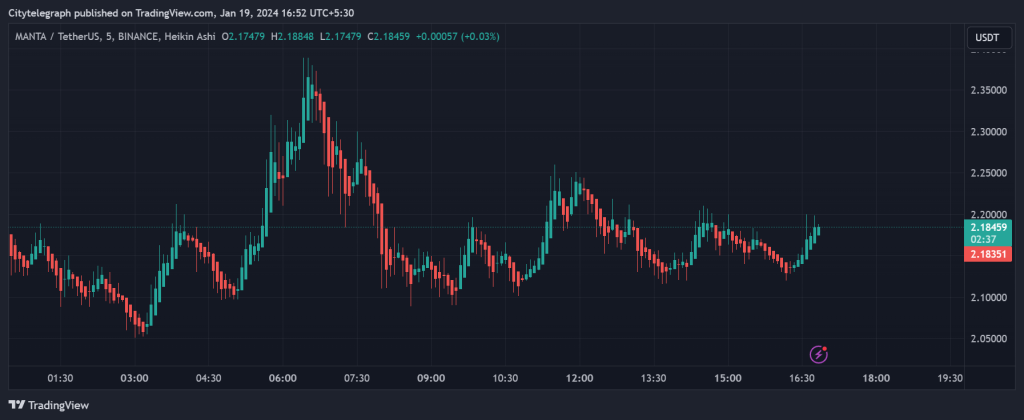
I’ve been keeping an eye on MANTA, a cryptocurrency listed on Binance, over the past 24 hours. The chart I’ve been looking at uses Heikin-Ashi candlesticks, a type designed to offer insights into the market trend. Currently, MANTA is priced at 2.18459 Tether (USDT), showing a modest 0.03% increase from yesterday.

Here are some highlights from the chart:
MANTA has been in a consolidation zone, hovering between 2.17 USDT and 2.20 USDT for the past few hours. This suggests a balanced market with both buyers and sellers at these levels.
A long green candle at the chart’s bottom indicates potential buying support in that range.
The volume is relatively low, indicating a lack of significant buying or selling pressure driving the current price movement.
Regarding support and resistance, support is where the price is likely to stop falling and rise, while resistance is where it might stop rising and start falling.
In the chart provided, there’s evident support around 2.17 USDT, as MANTA has bounced off that level multiple times in the past 24 hours. Resistance is noticeable around 2.20 USDT, as MANTA has struggled to surpass this level recently.
It’s crucial to understand that support and resistance levels aren’t foolproof predictions but rather historical areas where the price has shown patterns. Future behavior is uncertain, and these levels may not dictate price movements in the future.

