Shiba Inu, the meme coin that made waves in 2020 and hit its peak during the 2021 crypto boom, faced a drop in value. From a high of $32.84 billion, it’s now at $4 billion, ranking 18th on CoinMarketCap. But don’t count it out just yet! The Shiba Inu team bounced back, turning it from a regular meme coin into a thriving DeFi ecosystem.
This blog explores the future of Shiba Inu’s price from 2024 to 2030. We’ll look at its usefulness, how it works (tokenomics), its community, and where it stands in the bigger crypto picture. Despite the ups and downs, Shiba Inu’s journey is far from over. Join us as we analyze if 2024 holds a potential price boost for SHIB, using both technical analysis and predictions. Let’s break it down and see if Shiba Inu is set for a comeback in the coming years.
Shiba Inu Price History
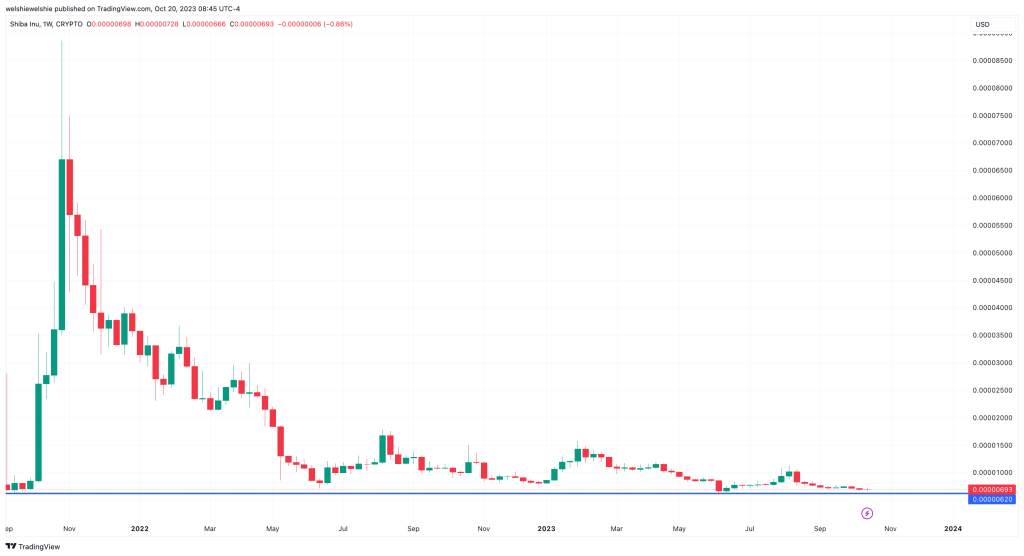
Shiba Inu started in August 2020 at a super tiny price of $0.000000001009, as per CoinMarketCap records. The price first shot up in May 2021, hitting a high of $0.00003469, thanks to a massive 457% jump on May 10.

After this all-time high (ATH), the price went through a quick correction and hung around $0.0000065 to $0.000008 for a while. But in October 2021, Shiba Inu’s price took off, surging over 1100% in less than a month to hit a new ATH of $0.00008845.
However, after hitting this high, the SHIB price dropped rapidly, finding support at $0.00000802 and $0.00001. Unfortunately, the recent trouble with the SEC suing Binance and Coinbase caused the price to dip below this support.
The price then briefly touched its long-term support of $0.00000620 from 2021, followed by a recent bounce, as shown on the Shiba Inu price chart.
The total supply of circulating Shiba Inu is a whopping 589,346,914,631,298 SHIB, with a current market cap of $4,098,907,791.
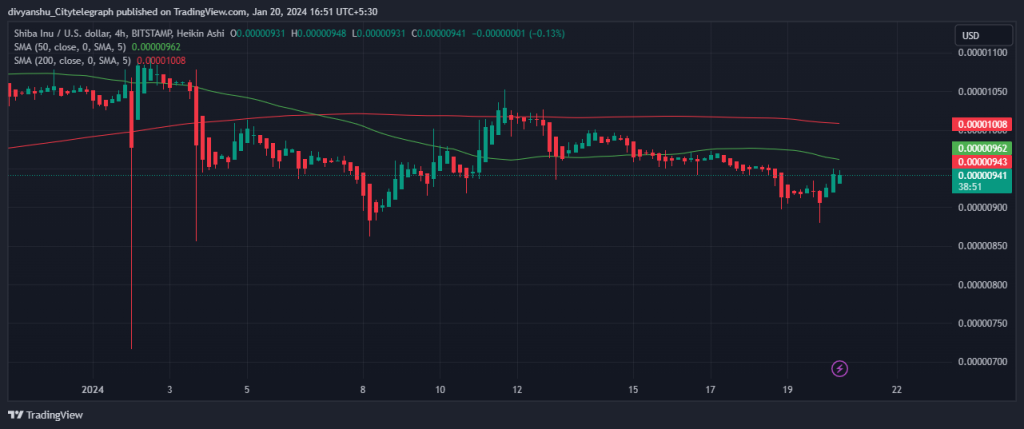
Moving Average of SHIB – SHIBA Inu’s Price Prediction Jan 2024 (Charting at 4H)

The chart above shows two lines that are used to analyze the value of Shiba Inu. One line is represented by a green color, and the other line is in red color. The green line shows the average value of SHIB over the last 50 days, while the red line shows the average value over the last 200 days. Currently, the green line is Under the Red line. However, it could indicate that SHIB’s value will decrease significantly. This is because the trend in the chart suggests that Shiba Inu’s value is likely to go down.
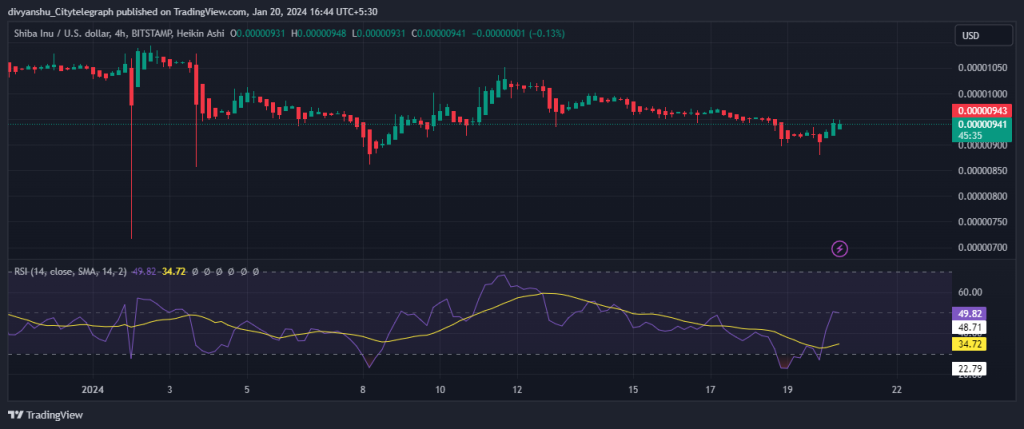
Relative Strength Index (RSI) of SHIB – Shiba Inu Price Forecast Jan 2024 (Charting at 4H)

The analysis of Shiba Inu’s price suggests that it may decrease soon. Two different indicators, the Relative Strength Index (RSI) and Simple Moving Average (SMA), both give the exact prediction. However, relying on technical analysis is always good to make better predictions. So, in this case, the moving average of SHIB’s price can help us better estimate its future price & price will decrease.
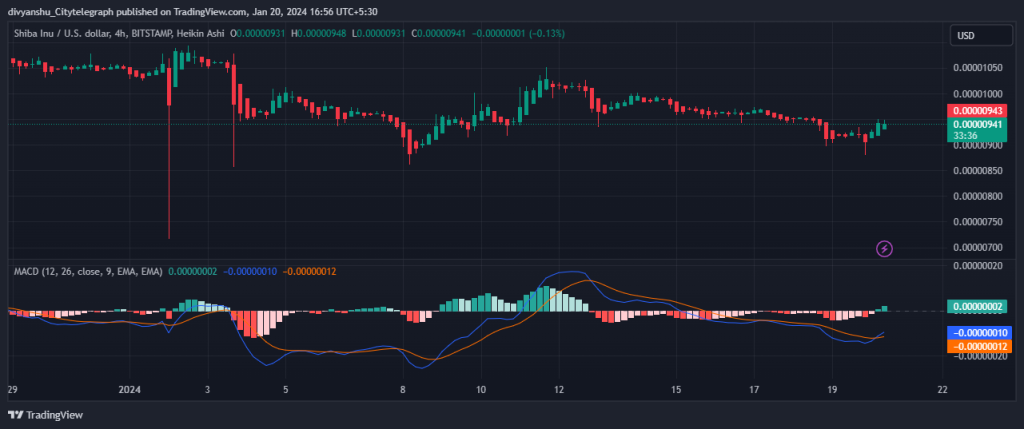
MACD of BTC – Price Prediction Jan 2024 (Charting at 4H)

Moving Average Convergence Divergence (MACD) can analyze SHIB’s price movement. This chart has two lines – the blue and orange lines. When the blue line crosses the orange line, there might be a change in the price trend. The blue line is increasing, suggesting that Bitcoin’s price may increase. However, the orange line is also going up, indicating that the SHIB price may decrease soon.
Three studies have been conducted to predict Bitcoin’s price in 2024. All three studies suggest that the cost of SHIBA Inu may decrease.

