While Near (NEAR) and especially Ethereum (ETH) are recovering well from yesterday’s sell-off, Cardano (ADA) slipped below its key support.
Ethereum (ETH): Ethereum can recover noticeably after the sell-off
Resistance: $2,733, $2,954, $3,155, $3,273, $3,361, $3,408, $3,577, $3,752, $3,898, $4,043, $4,158, $4,339, $4,547, $4,719, $4,864, $5,073 , 5,393 USD, 6,014 USD, 7,027 USD, 8,666 USD, 11,318 USD
Support: 2.659 USD, 2.571 USD, 2.305 USD, 2.161 USD, 2.044 USD, 1.930 USD, 1.725/1.713 USD, 1.545 USD, 1.425 USD
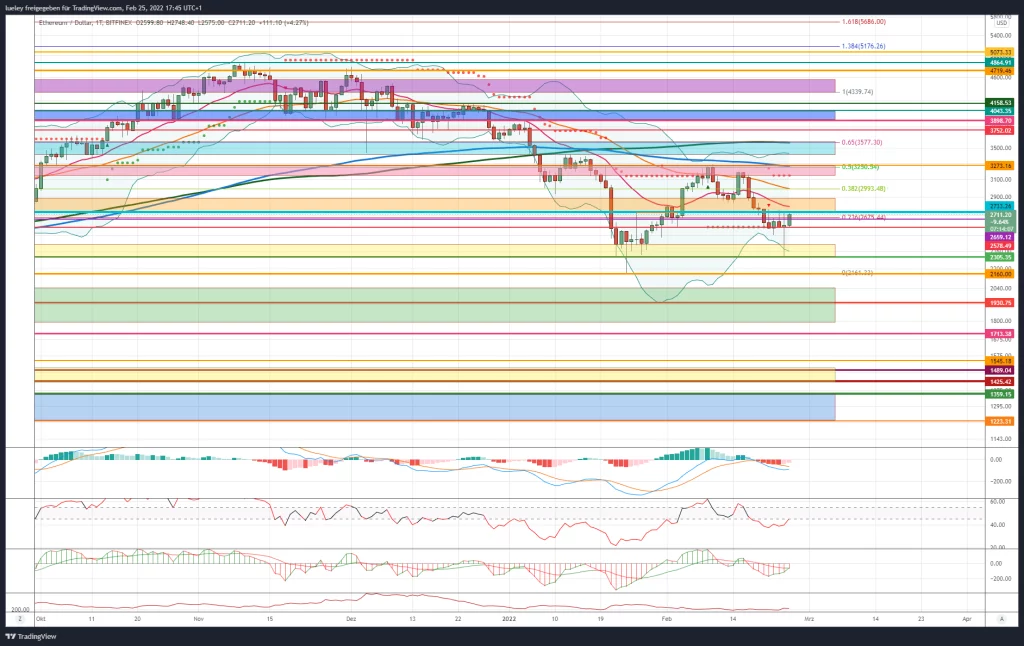
Price analysis based on the value pair ETH/USD on Bitfinex
- Ethereum must recapture USD 2,733 to generate price potential up to USD 2,954.
- Only a breakout above USD 3,273 brightens the chart image again.
- $2,305 as a key support level for the upcoming trading week.
The ether course had to bow again to the Bitcoin correction and slipped back to the strong support at USD 2,305. Only here did a clear countermovement back to USD 2,733 begin. Here the ether price initially bounced south on Friday, February 25, but can currently stabilize above USD 2,700. The bull camp must now try to stabilize the ether price above USD 2,733 in order to initiate another attempt to rise. Only a reconquest of USD 2,993 enables a march towards the historical high at USD 3,273.
Bullish Variant (Ethereum) ETH Price Prediction
Ethereum again failed to reach the USD 3,273 mark in the previous week. Instead, the price slipped again to the support at $2,305 before the bulls returned to the floor. The ether price is currently trading below the important resist at USD 2,733. If the bulls succeed in breaking out of this resistance in the coming trading days and the EMA20 (red) at USD 2,800 is also overcome, the upper edge of the orange resistance zone at USD 2,954 will initially come into focus as a target.
The bulls have to pass their first important test at USD 2,993. In addition to the 38 Fibonacci retracement, the EMA50 (orange) can also be found at this course mark. If USD 2,993 is broken through without renewed setbacks, the lower edge of the red resistance zone will again come into focus for investors. If Ethereum also dynamically overcomes USD 3,155 and thus jumps above the supertrend again, a renewed test of USD 3,273 should be planned. In addition to the high of February 10, 2022, the 50 Fibonacci retracement and the EMA200 (blue) can also be found here.
The chart image brightens
If the bulls can develop enough purchasing power and then form a new historical high, a subsequent increase into the turquoise resist zone should be planned. The MA200 (green) runs in the area of USD 3,589. In order to be able to break through this resistance zone, Bitcoin (BTC) must also recover significantly. If this area is overcome in the medium term, the next price target will be activated at USD 3,752. This price mark acts as the first resistance on the way to USD 3,898. Here, the bears will resist again to keep their chance for a fresh correction. On the other hand, if the buyer side succeeds in recapturing this technical chart hurdle, price targets of USD 4,043 and USD 4,158 will come into focus for investors.
This strong resistance zone is to be seen as the first overarching target area for the coming weeks of trading. A subsequent increase up to USD 4,339 is only conceivable if Ethereum also recaptures this zone in the long term. If Bitcoin also overcomes the area around USD 52,000 and rises towards USD 57,000, Ethereum should continue to rise towards USD 4,547. If this price mark is broken through in the form of the old all-time high without serious price setbacks, the zone between USD 4,719 and the all-time high at USD 4,864 will come into focus again. For now, this area is to be viewed as the maximum price target on the upside.
Bullish Variant (Ethereum) ETH Price Prediction
The seller side sent the Ether course back to the yellow support zone again. Only here did the bulls come back into the market and heave Ethereum back to the lower edge of the orange resistance zone at USD 2,733. As long as Ethereum does not break out of the historical high at USD 3,273, another sell-off can be expected at any time. A first indication would be a drop below the support mark at USD 2,578. If Ethereum breaks below this price level again, the yellow zone should be targeted again. If the bulls do not return to the floor, a retest of the low at USD 2,161 should be planned. If the selling pressure persists in this zone, a sell-off down to the green support zone is also conceivable.
Ethereum should then break away to at least USD 2,044, but more likely to USD 1,930. If the USD 1,930 is also undercut by the daily closing price, the chart picture will become even cloudier. The bulls should be there at the latest between USD 1,795 and USD 1,713 to avert a relapse below the low from the summer of 2021. The probability of a correction close to USD 1,545 would increase drastically. Even a retest of the support at $1,425 could be considered. The maximum bearish price targets for the coming months are unchanged at USD 1,359 and USD 1,223. From the current perspective, there is no more sales potential.
Indicators (Ethereum)
The RSI indicator is currently trying to climb back into the neutral zone between 45 and 55. If Ethereum continues to strive north, a new buy signal could form here in the coming trading days. The MACD, on the other hand, still has a sell signal, but it could turn it into a long signal as well. On a weekly basis, the bearish picture is unchanged. The RSI continues to trade below the neutral zone between 45 and 55.
Cardano (ADA): Abandonment of key support clouds chart image
- Rate (ADA): $0.88 (previous week: $0.99)
- Resistances/Targets: $0.93, $1.00, $1.10, $1.19, $1.25, $1.42, $1.48, $1.59, $1.77, 1 $.82, $1.91, $2.00
- Support: 0,82 USD, 0,75 USD, 0,70 USD, 0,58 USD, 0,48 USD, 0,39 USD, 0,33 USD, 0,26 USD
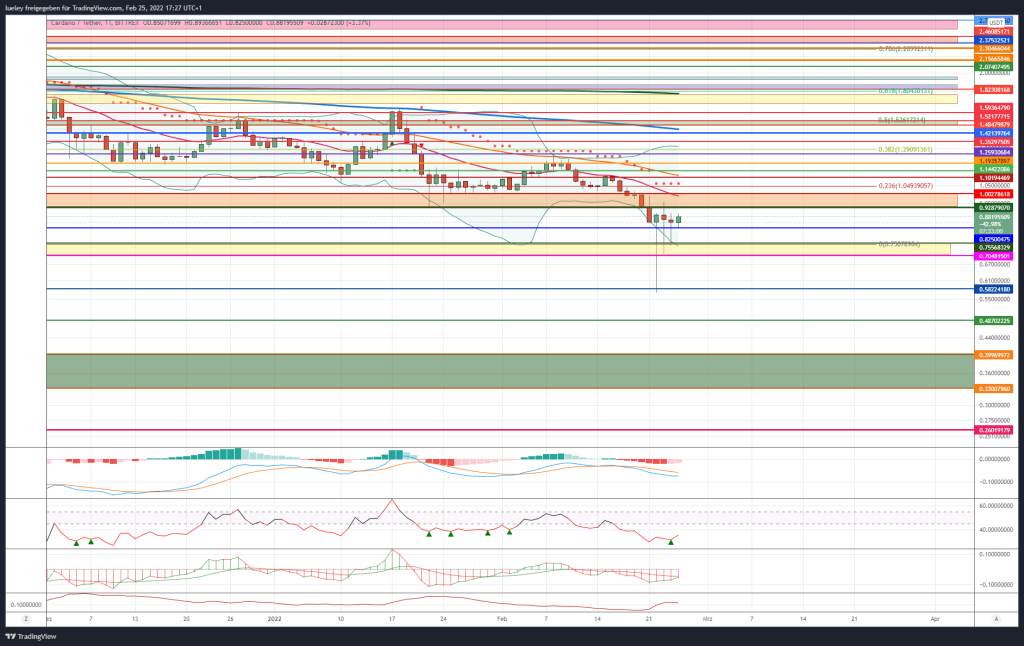
Price analysis based on the value pair ADA/USD on Bittr ex
- ADA price falls back below key support and falls to new 52-week low.
- USD 1.00 as the first important chart technical hurdle.
- USD 0.75 is now acting as initial support on the downside.
Cardano’s course also trended south as Bitcoin corrected. The Bittrex stock exchange chart used here even shows a low of around USD 0.50. This extreme price low is a good example of a lack of liquidity on a crypto exchange. The low at Binance and Co., on the other hand, is found at USD 0.75 and is therefore exactly in the important yellow support zone mentioned in the last Cardano analysis . The ADA course can currently changehowever, for now recovering somewhat and rallying back above the resistance at $0.82. However, to initiate an initial bounce, ADA price needs to recapture the key area between USD 0.93 and USD 1.00. On the downside, the $0.70-$0.75 zone is now acting as a key support zone.
Bullish Variant (Cardano) ADA Price Prediction
After the clear sell-off as an initial reaction to the start of the war in Ukraine yesterday, Thursday, the ADA course is currently recovering somewhat. At the low today, Cardano found support at the $0.82 support. The aim of the bulls must now be to heave Cardano back above USD 0.93 and especially USD 1.00 as quickly as possible in order to ban the danger of another sell-off in the short term. If the buyer side succeeds in recapturing the USD 1.00 mark and thus also overcoming the EMA20 (red), a subsequent increase towards USD 1.10 should be planned.
On the way, however, there is a first stumbling block with the super trend at USD 1.08. At the latest at USD 1.10 there is also the EMA50 (orange) in addition to a horizontal resistance mark. Cardano is likely to fail here in the first attempt. If there is a sustained relief rally for Bitcoin back towards its historical highs and ADA also rises to around USD 1.20 as a result, the risk of a relapse would be banned for the time being. If Cardano then stabilizes above USD 1.20, the focus turns again towards USD 1.25.
A first stabilization conceivable
If the buyer side manages to sustainably break through this strong resist and also break through the 38 Fibonacci retracement of the current movement at USD 1.29, the ADA rate should continue to rise and march through to USD 1.42. Here again a strong resistance awaits with the EMA200 (blue). In the zone between USD 1.48 and USD 1.52 at the latest, it should again be difficult for the bulls. This zone could not be recaptured in the long term on several occasions.
If the crypto market becomes increasingly bullish in the coming weeks, Cardano could take off up to USD 1.59. Once again, investors will want to take profits. Price targets at USD 1.77 and USD 1.82 are only activated when this resistance level is broken by the daily closing price. The latter resistance level can be seen as a make-or-break area for the coming months. Here the MA200 (green) continues to run next to the old demolition edge from November 2021. For the time being, this price level is to be regarded as the maximum bullish price target for the coming period.
Bearishe Variant (Cardano) ADA Price Prediction
The bears showed their paws again. The abandonment of the key support between USD 0.93 and USD 1.00 has left its mark. The seller side seems to have pushed the ADA price south enough in the short term, but renewed sell-offs are already to be expected in the orange zone. If the bear camp can cap the price below USD 1.00 and ADA falls back below USD 0.82 again in the coming trading days, the yellow support zone will again come into the focus of investors. If the price mark of USD 0.70 does not hold and is undercut at the end of the day, the chart picture will continue to cloud over. As a result, Cardano could also target lower price targets on the underside at USD 0.58 and USD 0.48. At most, a retest of the breakout level of February 2, 2021 is even conceivable. The support area around 0, USD 39 can currently be seen as a possible price target for the bears. Only if Cardano does not bounce significantly north here either and continues to weaken in the coming period, could a fall back to USD 0.33 or even USD 0.26 no longer be ruled out.
Indicators (Cardano) ADA Price Prediction
Both the RSI and the MACD indicator show active sell signals in the daily chart. The same can also be seen on a weekly basis. Here, too, both indicators continue to show active sell signals. While both indicators remain oversold, as long as there is no sign of a sustained reversal, this status is negligible for the time being.
support zone. If the overall market again tends more clearly to the south in the coming trading weeks, Avalanche could even fall back to the historical low from September 2021 at USD 32.21. From the current perspective, this support is to be regarded as the maximum bearish price target.
NEAR (Near): Near can stabilize at key support
- Course (NEAR): $8.81 (previous week: $10.30)
- Resistances/Targets: $9.50, $10.51, $11.71, $13.28, $15.96, $17.65, $20.63, $24.75
- Supports: $8.36, $7.58, $6.66, $6.11, $4.80, $3.54

Price analysis based on the value pair NEAR/USD on Binance
- Near price bounces north on key support at $7.58.
- First price target at $9.50.
- Parent support at $6.11.
In January of this year, Near made a new all-time high of around USD 20.63. Starting from this level, the NEAR price initially fell to the EMA200 (blue) at USD 9.50, where there was initially an interim stabilization. However, amid the overall market weakness, the near continued to slide, marking a fresh historical low of $7.42 yesterday, Thursday, February 24, before the bulls returned to the floor and hauled the price back above the $8.36 resistance . The aim of the bulls must now be to let the NEAR price quickly rise back above USD 9.80 and thus brighten the chart image again.
Bullish Variant (Near) NEAR Price Prediction
The buyer side was able to avert a total crash for the time being. If the NEAR price stabilizes above USD 7.78 in the coming trading days and can recapture the zone between USD 9.50 and USD 9.80, this would be a first indication of strength. If the resistance at USD 10.50 is subsequently broken through, a first directional decision in the range between USD 11.37 and USD 11.90 can be expected. There is a whole bunch of potential hurdles here with the Supertrend, the EMA50 (orange) and the 38 Fibonacci retracement. If the buyer camp can also recapture this zone in the coming weeks, the focus will be on USD 13.28. Near has failed here several times in the past.
If the NEAR price also jumps back above this resistance, price targets at USD 15.08 and USD 17.52 will be activated. Both marks are derived from Fibonacci retracements. If the bulls manage to pulverize the NEAR price in the medium term, even this price resistance, a retest of the all-time high at USD 20.35 is conceivable. Investors are likely to want to take profits here again. If the NEAR course can get stuck in this zone, an increase to the 138 Fibonacci extension is also possible in the medium term. Since the price-limiting upward trend line also runs in this zone, a direct breakout above USD 26.20 is not to be planned. For the coming months, the maximum target price for Near is $29.60. This mark is derived from the 161 Fibonacci price projection.
Bearish Variant (Near) NEAR Price Prediction
The bears pummeled the NEAR price to the horizontal support at $7.58 before the bulls increasingly resisted. As long as the seller is able to cap the price below USD 9.80, a retest of the historical low can be expected at any time. A first indication of renewed price weakness would be the sustained drop below USD 8.36. Then Near should immediately correct to the low of USD 7.40. If the NEAR price also undercuts this price mark at the end of the day, the correction extends into the green support area. The zone between USD 6.66 and USD 6.11 already acted as a strong support area several times in 2021.
In the first attempt, a rebound to the north should therefore be planned. If the weakness in the overall market expands in the coming trading weeks and Near slips below USD 6.11, the next support at USD 4.80 will come into focus for investors. This course mark was heavily contested several times in 2021. If Near cannot stabilize at this support either and also gives up this price mark for a long time, the price correction expands in the direction of the maximum bearish price target at USD 3.54. This price level was the starting point for the rally to the all-time high in August of the previous year. The bulls will therefore do everything in their power to move the NEAR course north again in the long term.
Indicator (Near)
Both the RSI indicator and the MACD indicator are currently showing a sell signal. Only when jumping back above USD 9.80 could the indicators activate new long signals.