The Swipe (SXP) cryptocurrency has been trading in a long-term range since September 2020. At the moment, Swipe is inside a short-term resistance zone and a channel. Will it deviate from these levels and break out? The direction of a strong short-term trend depends on the answer to this question in the next day or two.
Cryptocurrency Swipe (SXP): Long Term Range
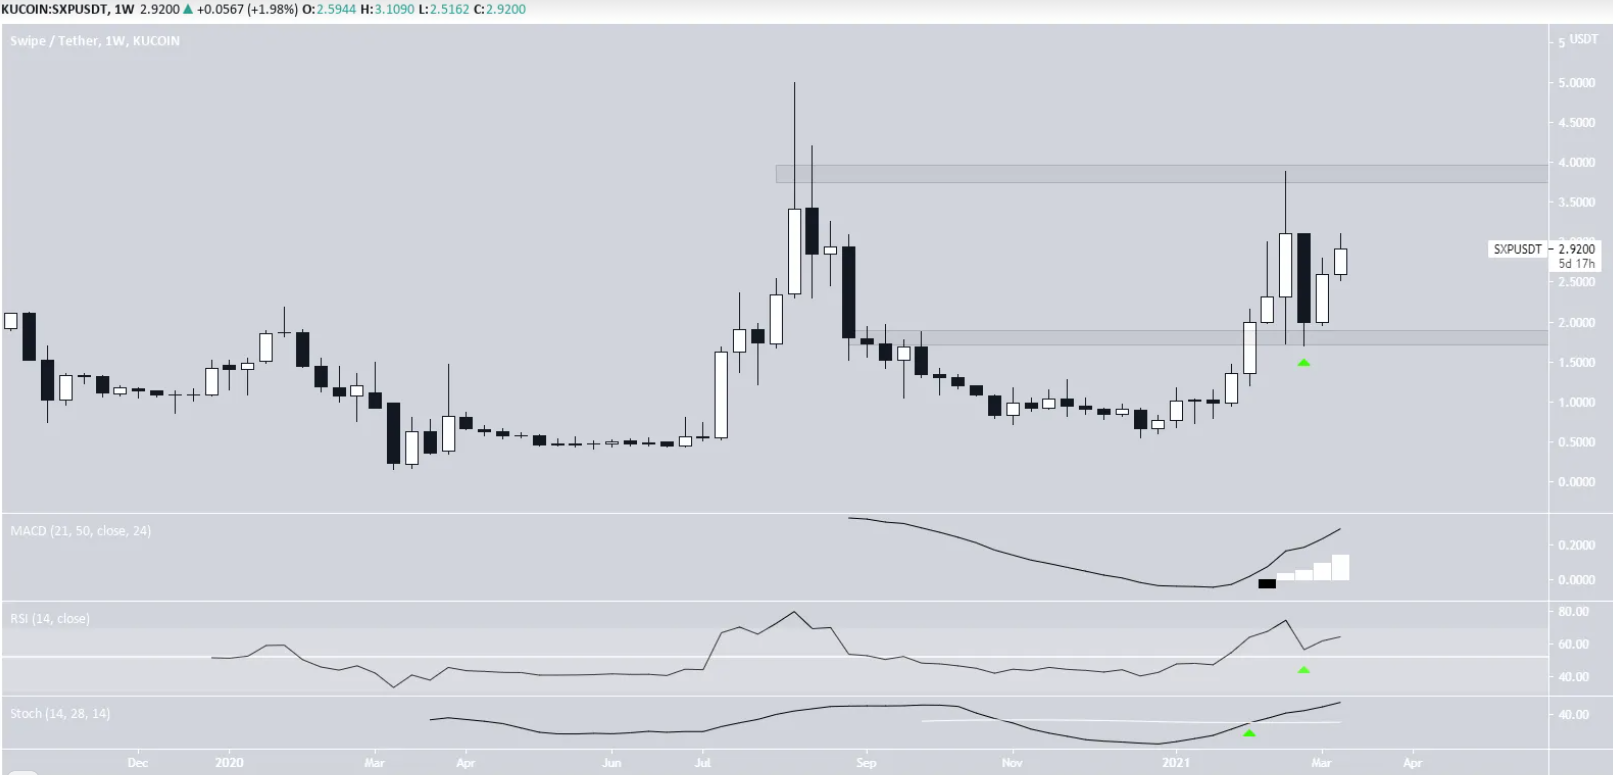
SXP hit an all-time high of $ 3.99 in August 2020, but couldn’t hold out. Having formed a very long wick, the coin rolled back. Since then, the SXP has been declining, reaching a low of $ 0.55 in December 2020. But since then, the SXP has moved slowly and steadily upward.
On February 21, the SXP managed to rally significantly and reach the $ 3.90 resistance zone. However, the resistance cannot be accurately set due to the many long upper wicks. The ensuing drop pushed the SXP into the $ 1.80 support zone. The SXP is currently trading in a range between these two levels.
Technical indicators are currently confirming the bullish direction. A bullish cross has occurred in the Stochastic Oscillator and the MACD rallied above the centerline.

New impulse or pullback?
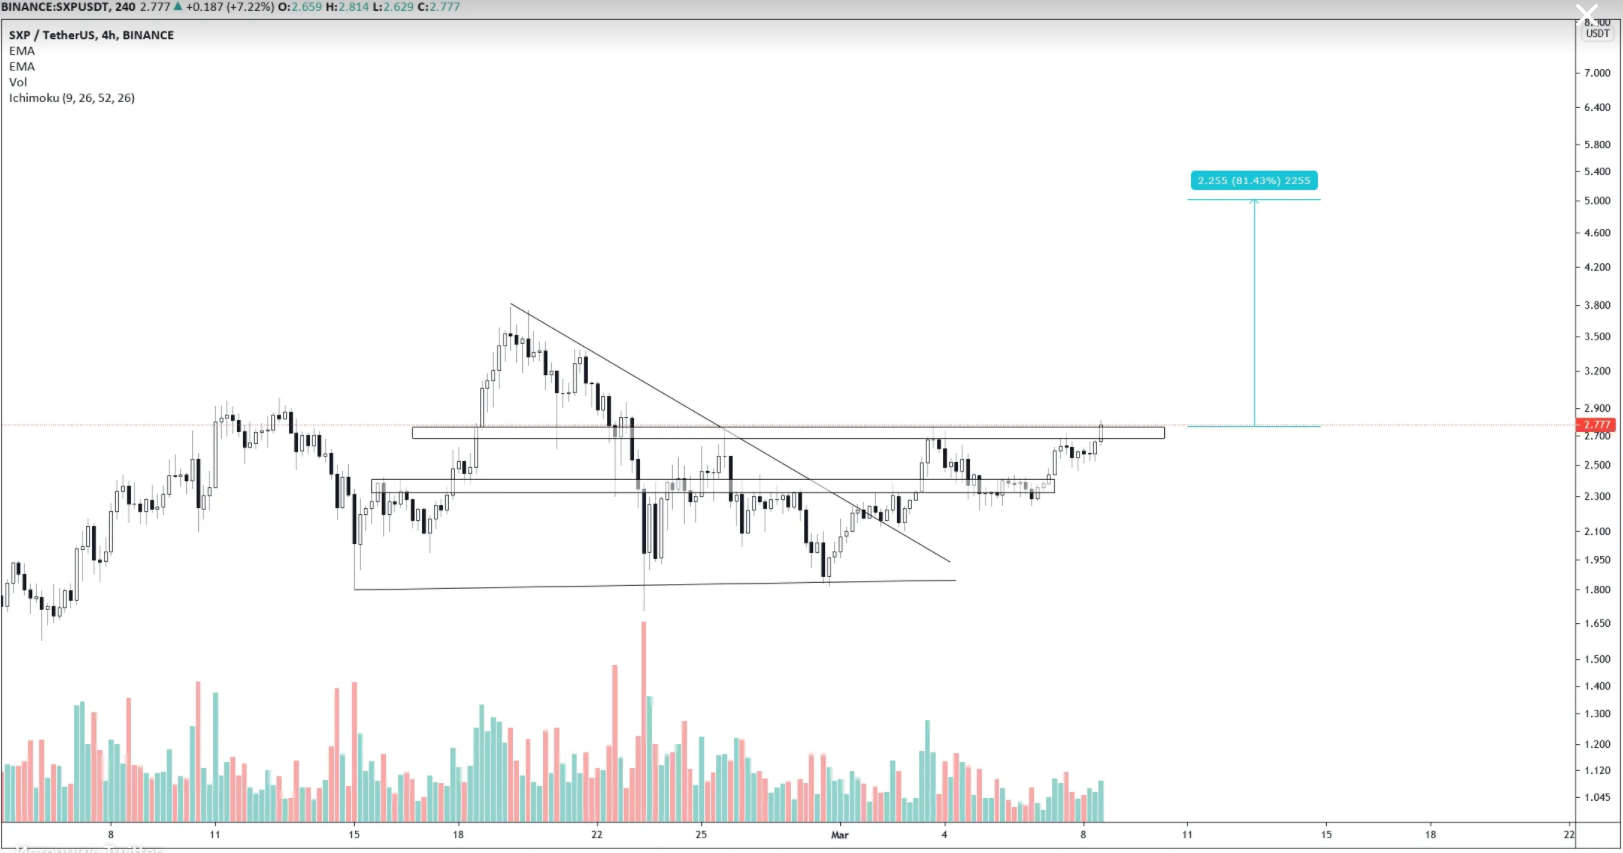
Cryptocurrency trader @Thebull_Crypto stated that as soon as the SXP rises above the horizontal level, it will rise to $ 5.

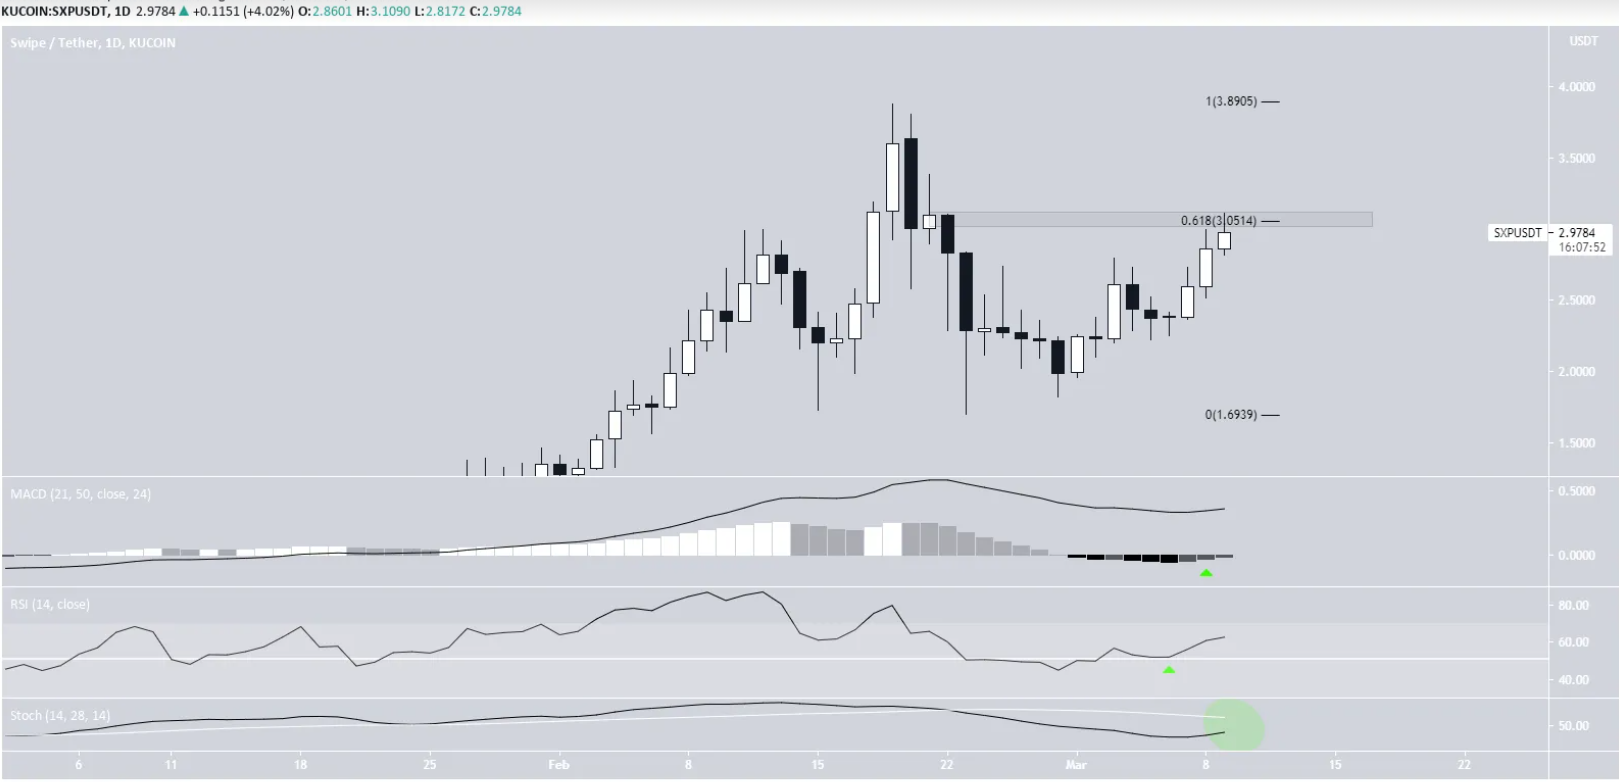
The aforementioned horizontal level is at $ 3.05. This price coincides with the Fibo retracement level of 0.618 from the last decline. Similar to the weekly timeframe, technical indicators confirm bullish sentiment on the daily (D1). This, in particular, is evidenced by the bullish reversal in the MACD.
However, until the SXP manages to close above this area, we cannot say with confidence that the correction is over.

The six-hour chart confirms this. It shows that the SXP is trading within a parallel channel. The movement contained in the parallel lines is often corrected.
Since the channel resistance coincides with the horizontal resistance zone, a breakout is needed to confirm the bullish trend.
Counting waves on the SXP chart
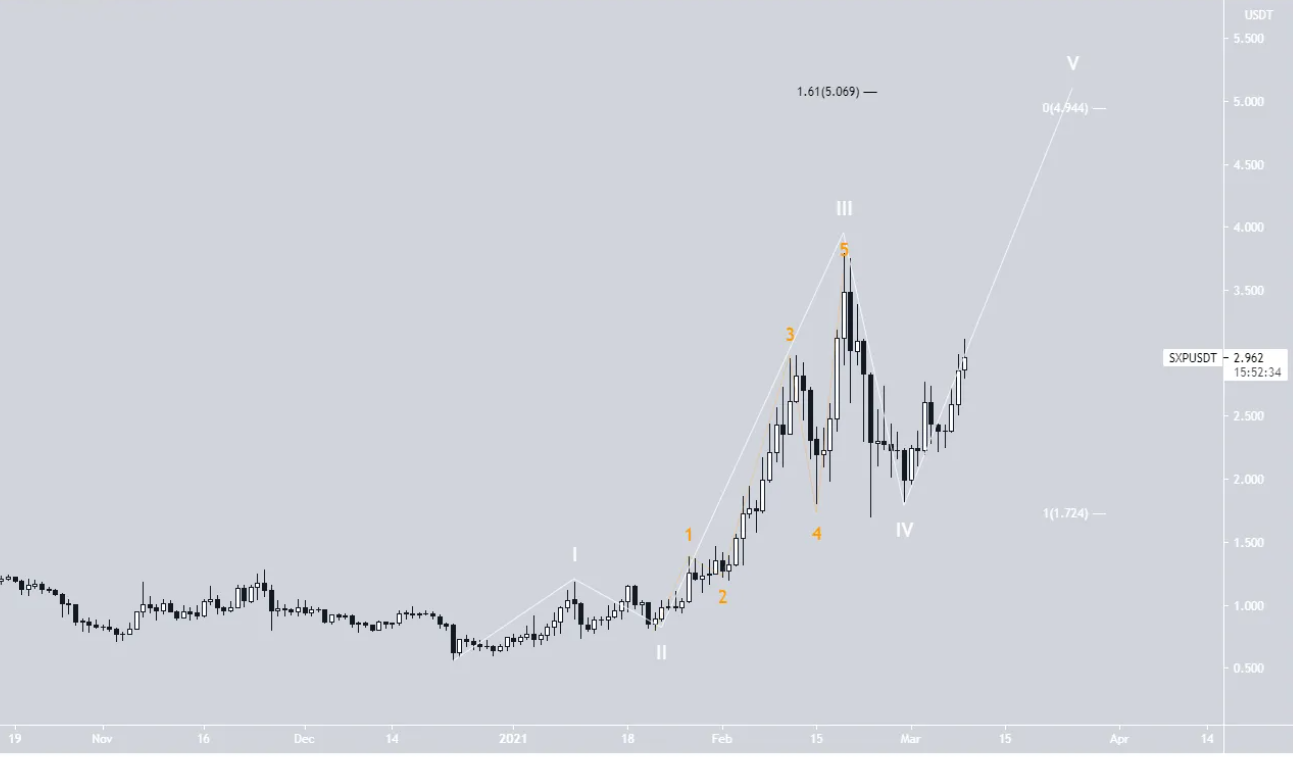
The number of waves indicates that the SXP has either just begun the fifth wave or is in the fourth wave of bullish impulse (white). It is not yet clear whether the fourth wave has completed or it will develop into a triangle or a complex correction.

However, the price is expected to eventually complete the fifth wave, which is likely to drive it to a new all-time high. The most likely target for the top of the move is between $ 4.94- $ 5.05
Output
The short-term swipe trend remains uncertain until the rate declines or breaks above $ 3.05. However, the long-term trend is considered bullish and a new record high price is expected eventually.

