Here are some charts worth keeping an eye on as we navigate the bull market cycle.
Here are some charts worth keeping an eye on as we navigate yet another exciting bull market cycle.
This week’s updates include:
-
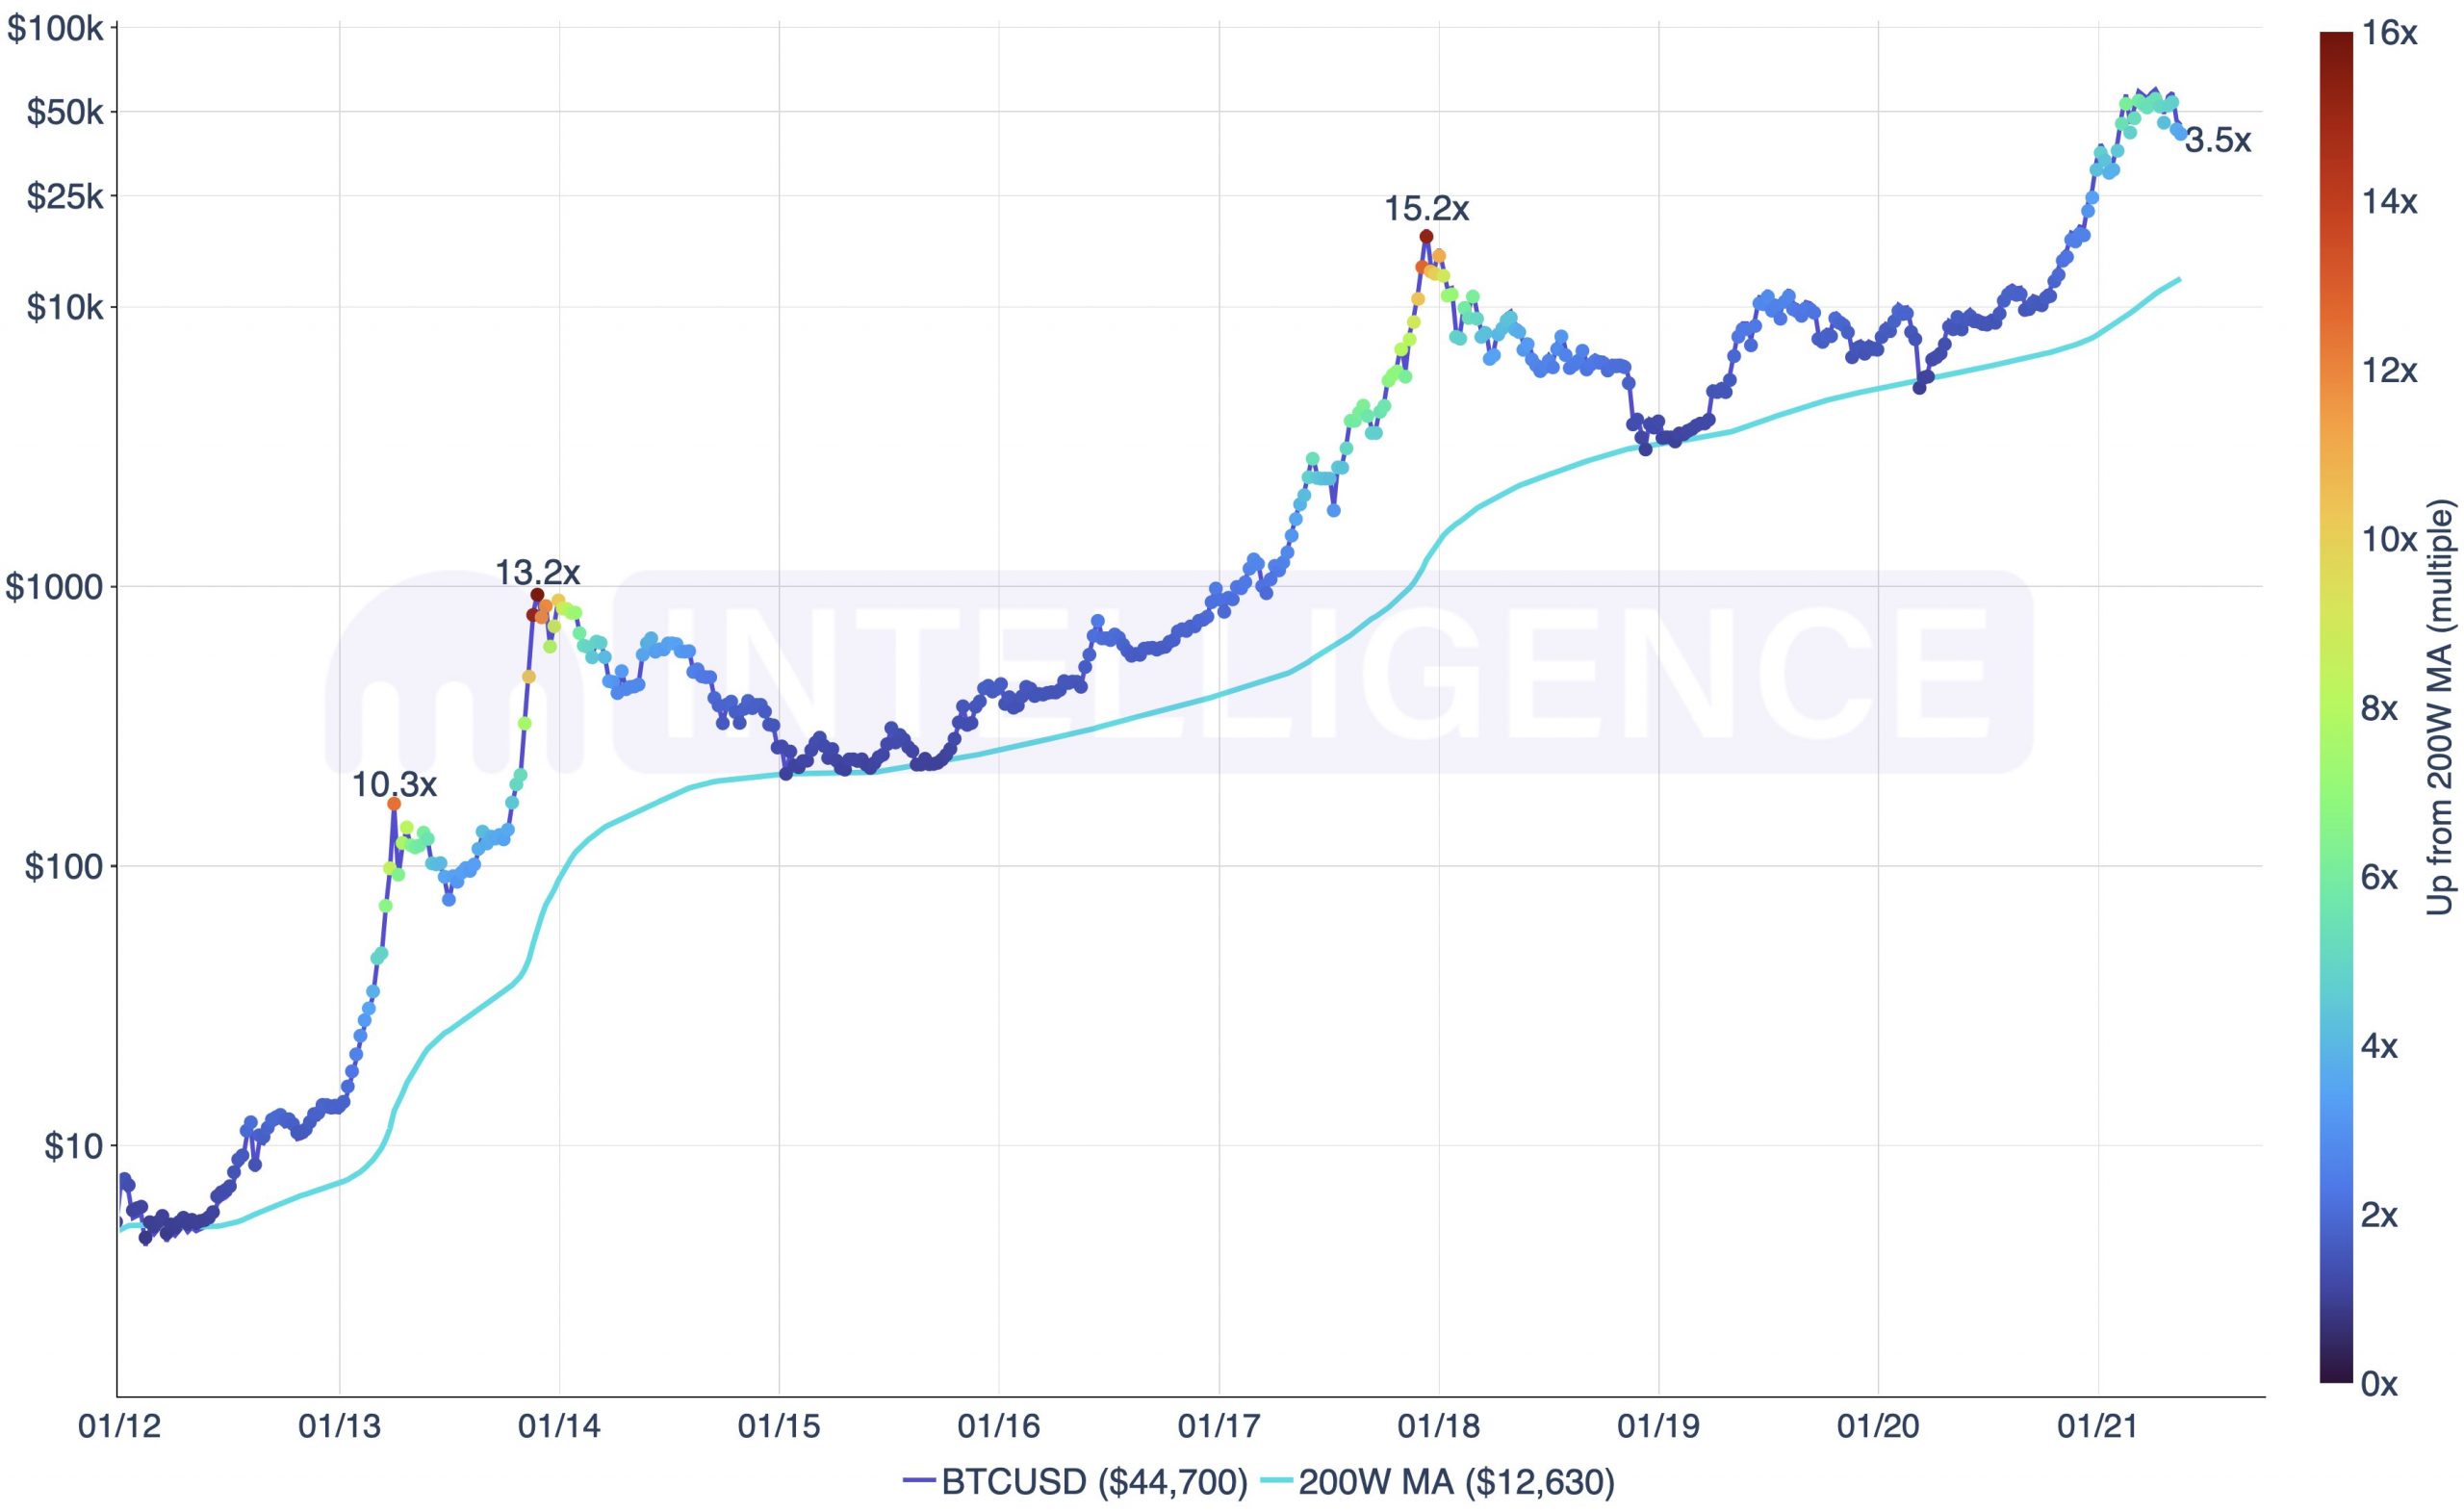
BTC’s 200-Week Moving Average has fallen to a 3-month low of 3.54x, well below the historical 10x – 15x multiple we’ve seen in prior bull market cycles.
-
BTC posted a weekly close below the Bull Market Weekly Support on Sunday, May 16 for the first time since April 2020. In 2013 and 2017, BTC momentarily traded below said support before ultimately resuming its macro uptrend.
-
BTC’s 14-Month RSI is currently 69.9 and back in “neutral” territory for the first time since October 2020. This reversion lower suggests BTC is trending in a manner akin to the 2013 bull market.
-
BTC’s MVRV Z-score of 2.94 is down -28% from last week’s reading of 4.09 and sits at a 5-month low. BTC was trading at $19,400 the last time its z-score was this low.
-
BTC’s SOPR Indicator has fallen to a reading of 1.0126, a level last seen in September 2020. With the SOPR indicator fast approaching a reading of 1, one could expect BTC to bounce higher in the days/weeks ahead.

How To Read This Chart:
-
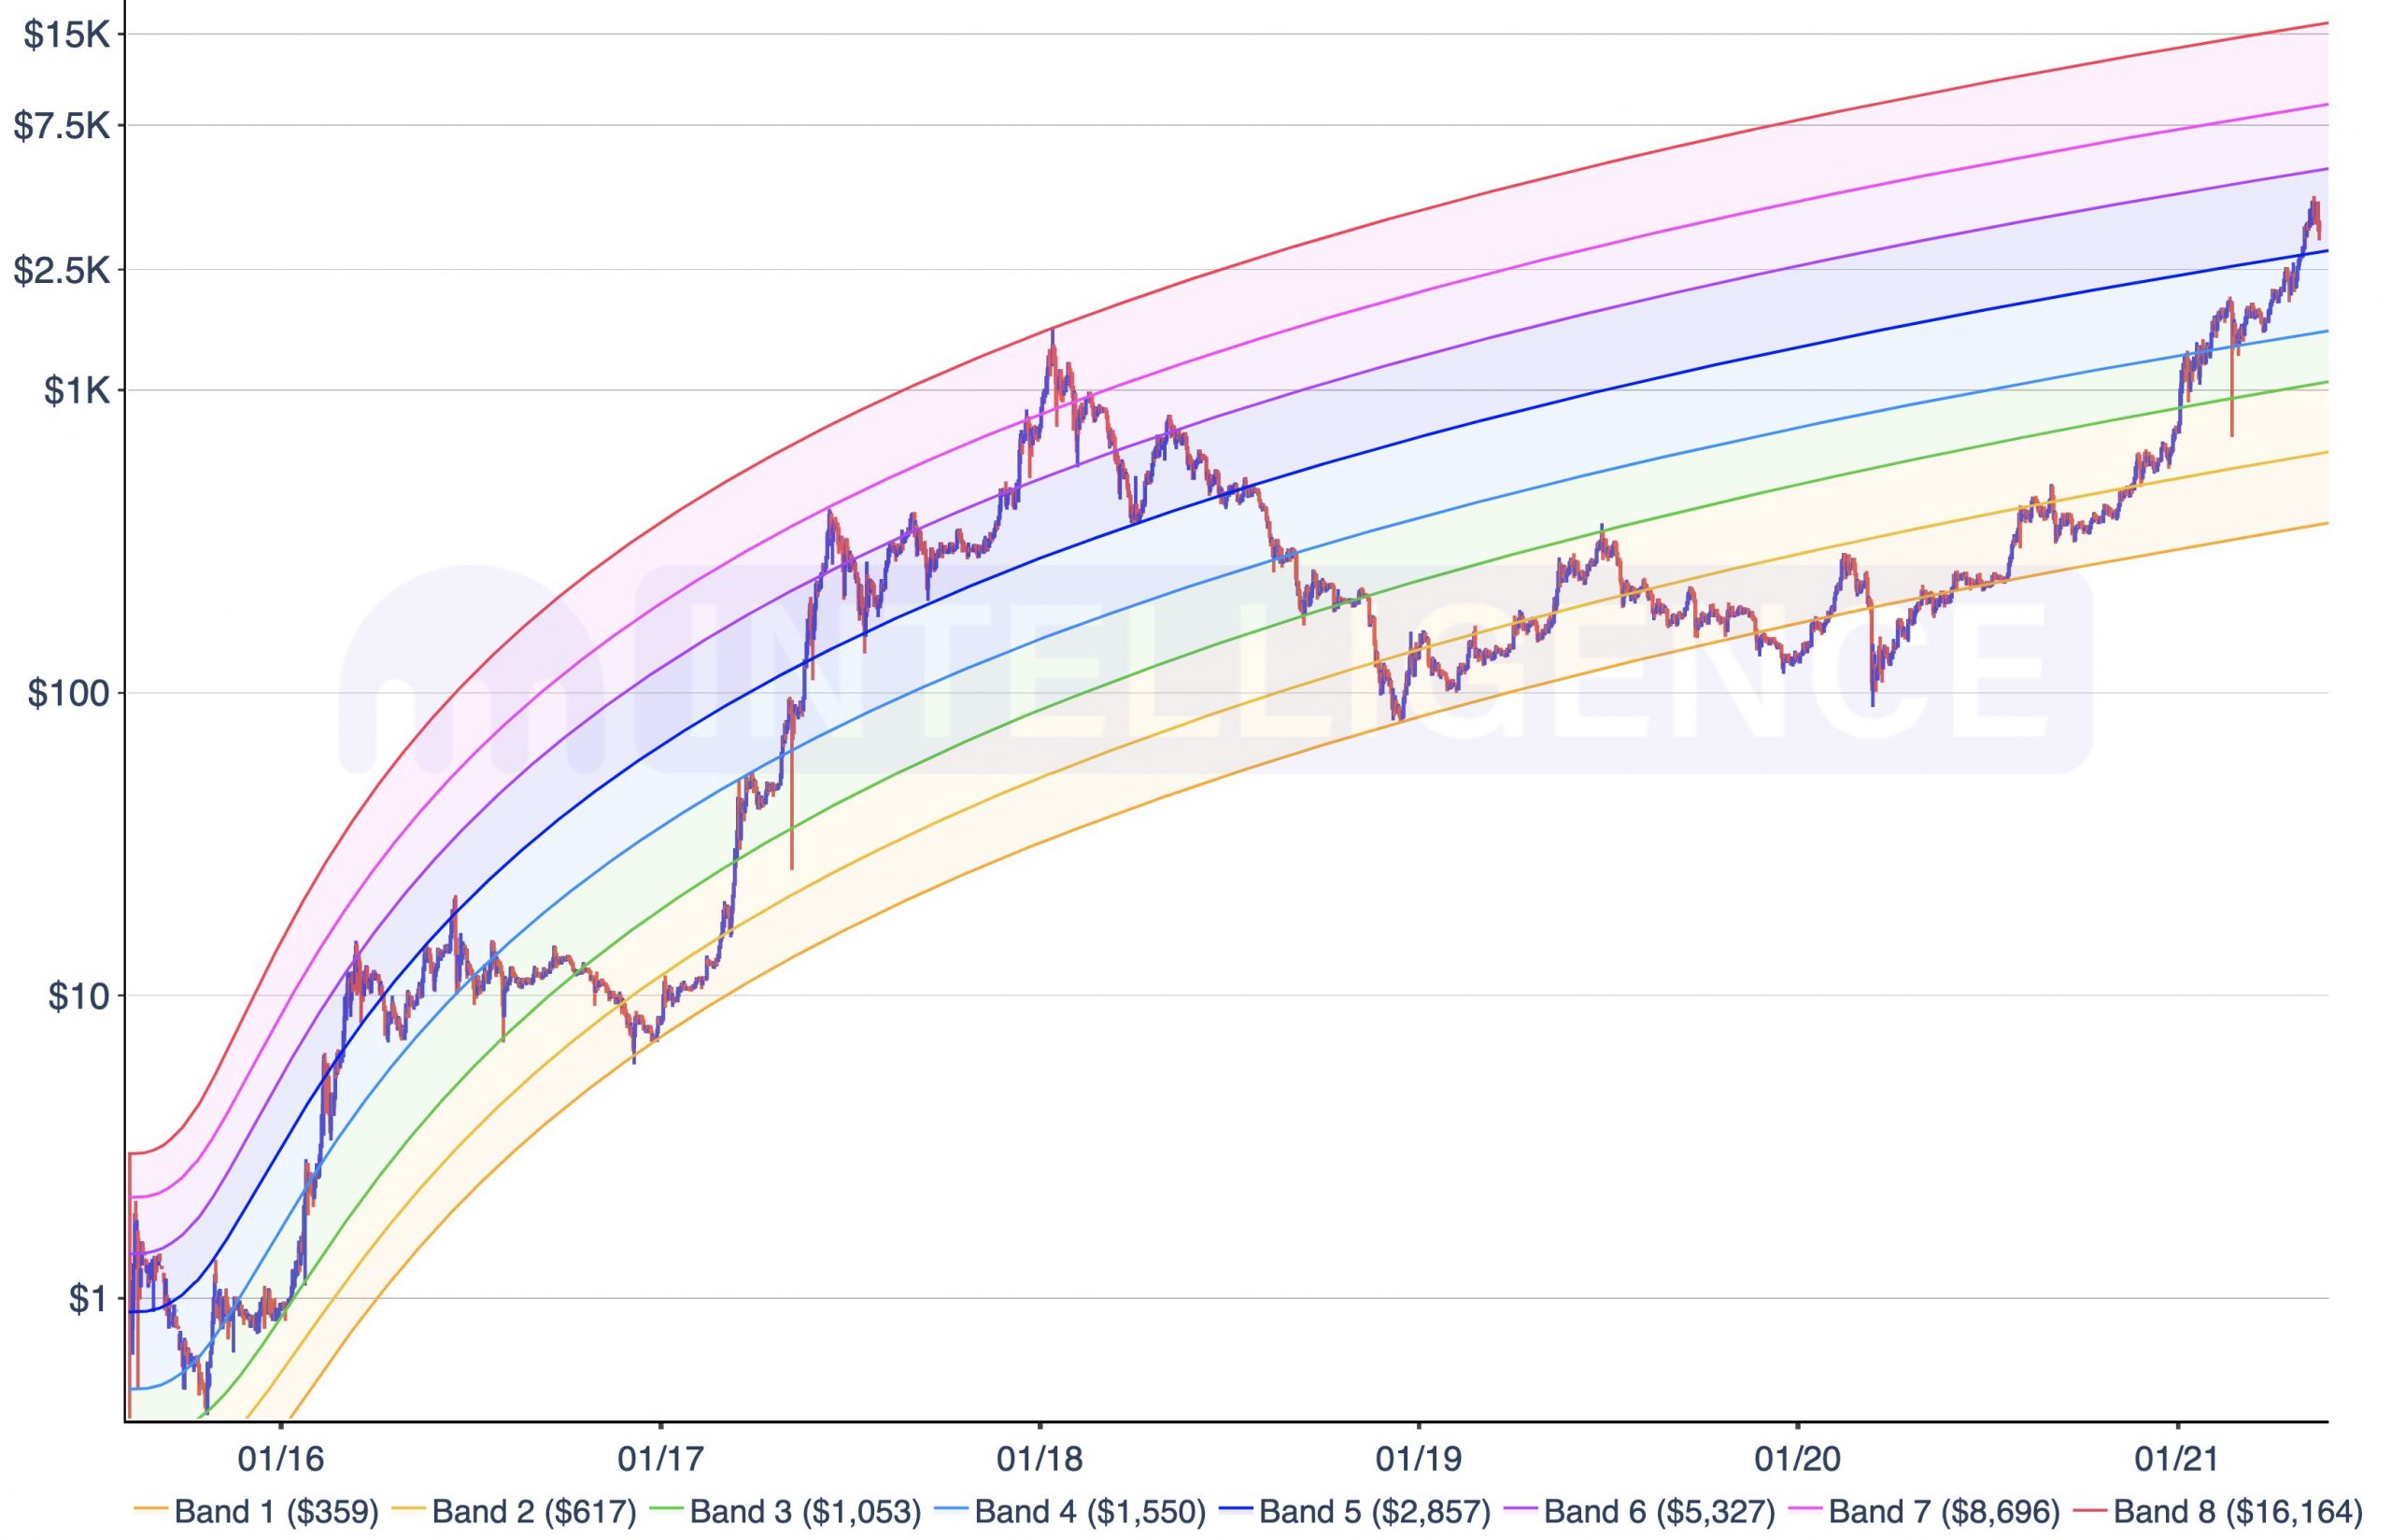
Using ETH’s historical price action, we can plot logarithmic regression trendlines that coincide with historical levels of support and resistance.
-
These lines can be useful for navigating bull and bear market cycles, as well as for identifying critical levels of support and resistance.
-
Do note that with each day that passes, ETH’s logarithmic regression rainbow trends higher. This means the longer ETH can continue to trend higher to the next subsequent regression trendline, potentially the higher the market cycle top.
What You Should Know:
-
At a current price of $3,392, ETH currently resides between Band 5 ($2,857) and Band 6 ($5,327).
-
Based on these regression lines, ETH’s next big test of resistance is currently at $5,327 while support resides around $2,857.
-
ETH would have to rally +57% to test resistance at $5,327 and would have to correct -16% to test support at $2,857.
-
A move up to Band 8, which coincides with ETH’s previous market cycle top, would imply a $16,164 Ether and a +313.0% return from current price.

How To Read This Chart:
-
BTC’s +1 Yr. HODL Wave shows what percentage of coins in circulation haven’t been moved in at least 1 year.
-
When charted against BTC’s price, one can identify trends that coincide with bull and bear market cycles.
-
Historically, a local top in the +1 Yr. HODL wave is congruent with the start of a new bull market. When the number of untouched coins begins to decline amid rapid price appreciation, one can be confident that a new bull market cycle is likely underway.
-
When the downward slope of the HODL wave grows increasingly steeper, one can assume that selling pressure is beginning to increase and supply is likely to outpace demand. As such, a cycle top is presumably creeping closer.
-
Prior to hitting a local high, a gradual increase in the +1 Yr. HODL wave signals that market participants are in “accumulation mode.”
What You Should Know:
-
BTC’s current +1 Yr. HODL Wave reading sits at 54.67%, i.e. 54.67% of all coins in circulation haven’t been moved in more than a year. This is down -8.7 percentage points from a local top of 63.4% set on September 9, 2020.
-
On January 31, 2013, BTC’s +1 Yr. HODL Wave hit a local high of 48.2% and the price of BTC was at $20.40. When BTC hit a cycle high of $1,158 on November 30, 2013, the +1 Yr. HODL Wave reading was at 38.8%. That is, over the course of 303 days, the number of coins that hadn’t been moved in more than a year had fallen 9.4 percentage points while price appreciated +5,580%.
-
On January 19, 2016, BTC’s +1 Yr. HODL Wave hit a local high of 61.5% and the price of BTC was at $380. When BTC hit a cycle high of $19,660 on December 17, 2017, the HODL Wave reading was at 43.1%. That is, over the course of 698 days, BTC’s HODL Wave fell -18.4 percentage points while price appreciated +5,073%.

How To Read This Chart:
-
200W Moving Average: A critical level of support used to determine an overall long-term market trend. The trendline measures the average price of BTC over the prior 200 weeks.
-
Moving Average Multiple: The multiple with which BTC is trading at relative to its 200-week moving average. For example, a multiple of 4.0x means BTC is trading at 4x its 200-week moving average.
What You Should Know:
-
In prior bull market cycles, BTC has traded as much as 10x – 15x its 200-week moving average prior to entering a bear market.
-
BTC’s 200-week moving average is 3.54x. That is, BTC is trading at 3.54x its 200-week moving average ($12,630), down from last week’s multiple of 3.74x and representing a 3-month low.
-
Given today’s 200-week moving average of $12,630, a 10x – 15x multiple would imply a BTC price of $126,300 – $189,450.
-
BTC’s 200-week moving average multiple hit a local high of 10.3X for the week of April 4, 2013. On April 9, 2013, BTC hit a cycle high of $259.
-
BTC’s 200-week moving average multiple hit a local high of 13.2X for the week of November 25, 2013, which coincided with a market cycle top of $1,158.
-
BTC’s 200-week moving average multiple hit a local high of 15.2X for the week of December 11, 2017. That same week, price hit a cycle high of $19,660.

How To Read This Chart:
-
BTC’s Bull Market Weekly Support tracks two critical levels of support that have acted as last lines of defense in prior bull market cycles: BTC’s 20-week exponential moving average and 21-week simple moving average.
-
In prior bull market cycles, BTC has mean reverted down to the 20W EMA and 21W SMA before bouncing and resuming its uptrend.
-
When BTC breaks below both moving averages, the likelihood of BTC’s bull market coming to an end is heightened.
What You Should Know:
-
At a price of $44,700, BTC’s 20-week exponential moving average is $46,823 and its 21-week simple moving average is $48,370.
-
BTC posted a weekly close below the bull market weekly support on Sunday, May 16 for the first time since March 2020. Although bearish, we’ve seen several instances in the past where BTC momentarily traded below the weekly support band before resuming its macro uptrend.
-
A move back up to BTC’s 20-week exponential moving average equates to a +4.8% gain from current price.
-
A return back above BTC’s 21-week simple moving average equates to a +8.2% rally from current levels.

How To Read This Chart:
-
BTC’s logarithmic growth curve consists of two sets of curved trendlines that have historically proven to be critical levels of support and resistance.
-
While both lines point to price ranges whereby BTC is arguably “overbought” or “oversold,” they also represent a notable underlying property of BTC that can be found in social networks, technological innovations, pandemics, societies, and economics: exponential growth.
What You Should Know:
-
BTC is a +86% to +144% move away from entering into “overbought” territory, which is currently between $83,306 and $109,134.
-
BTC is a -50% to -62% move away from falling into “oversold” territory. This week’s range is $17,143 – $22,458.
-
At a current price of $44,700, BTC resides in the 49 percentile of the logarithmic growth curve’s $17,143 – $109,134 range.

How To Read This Chart:
-
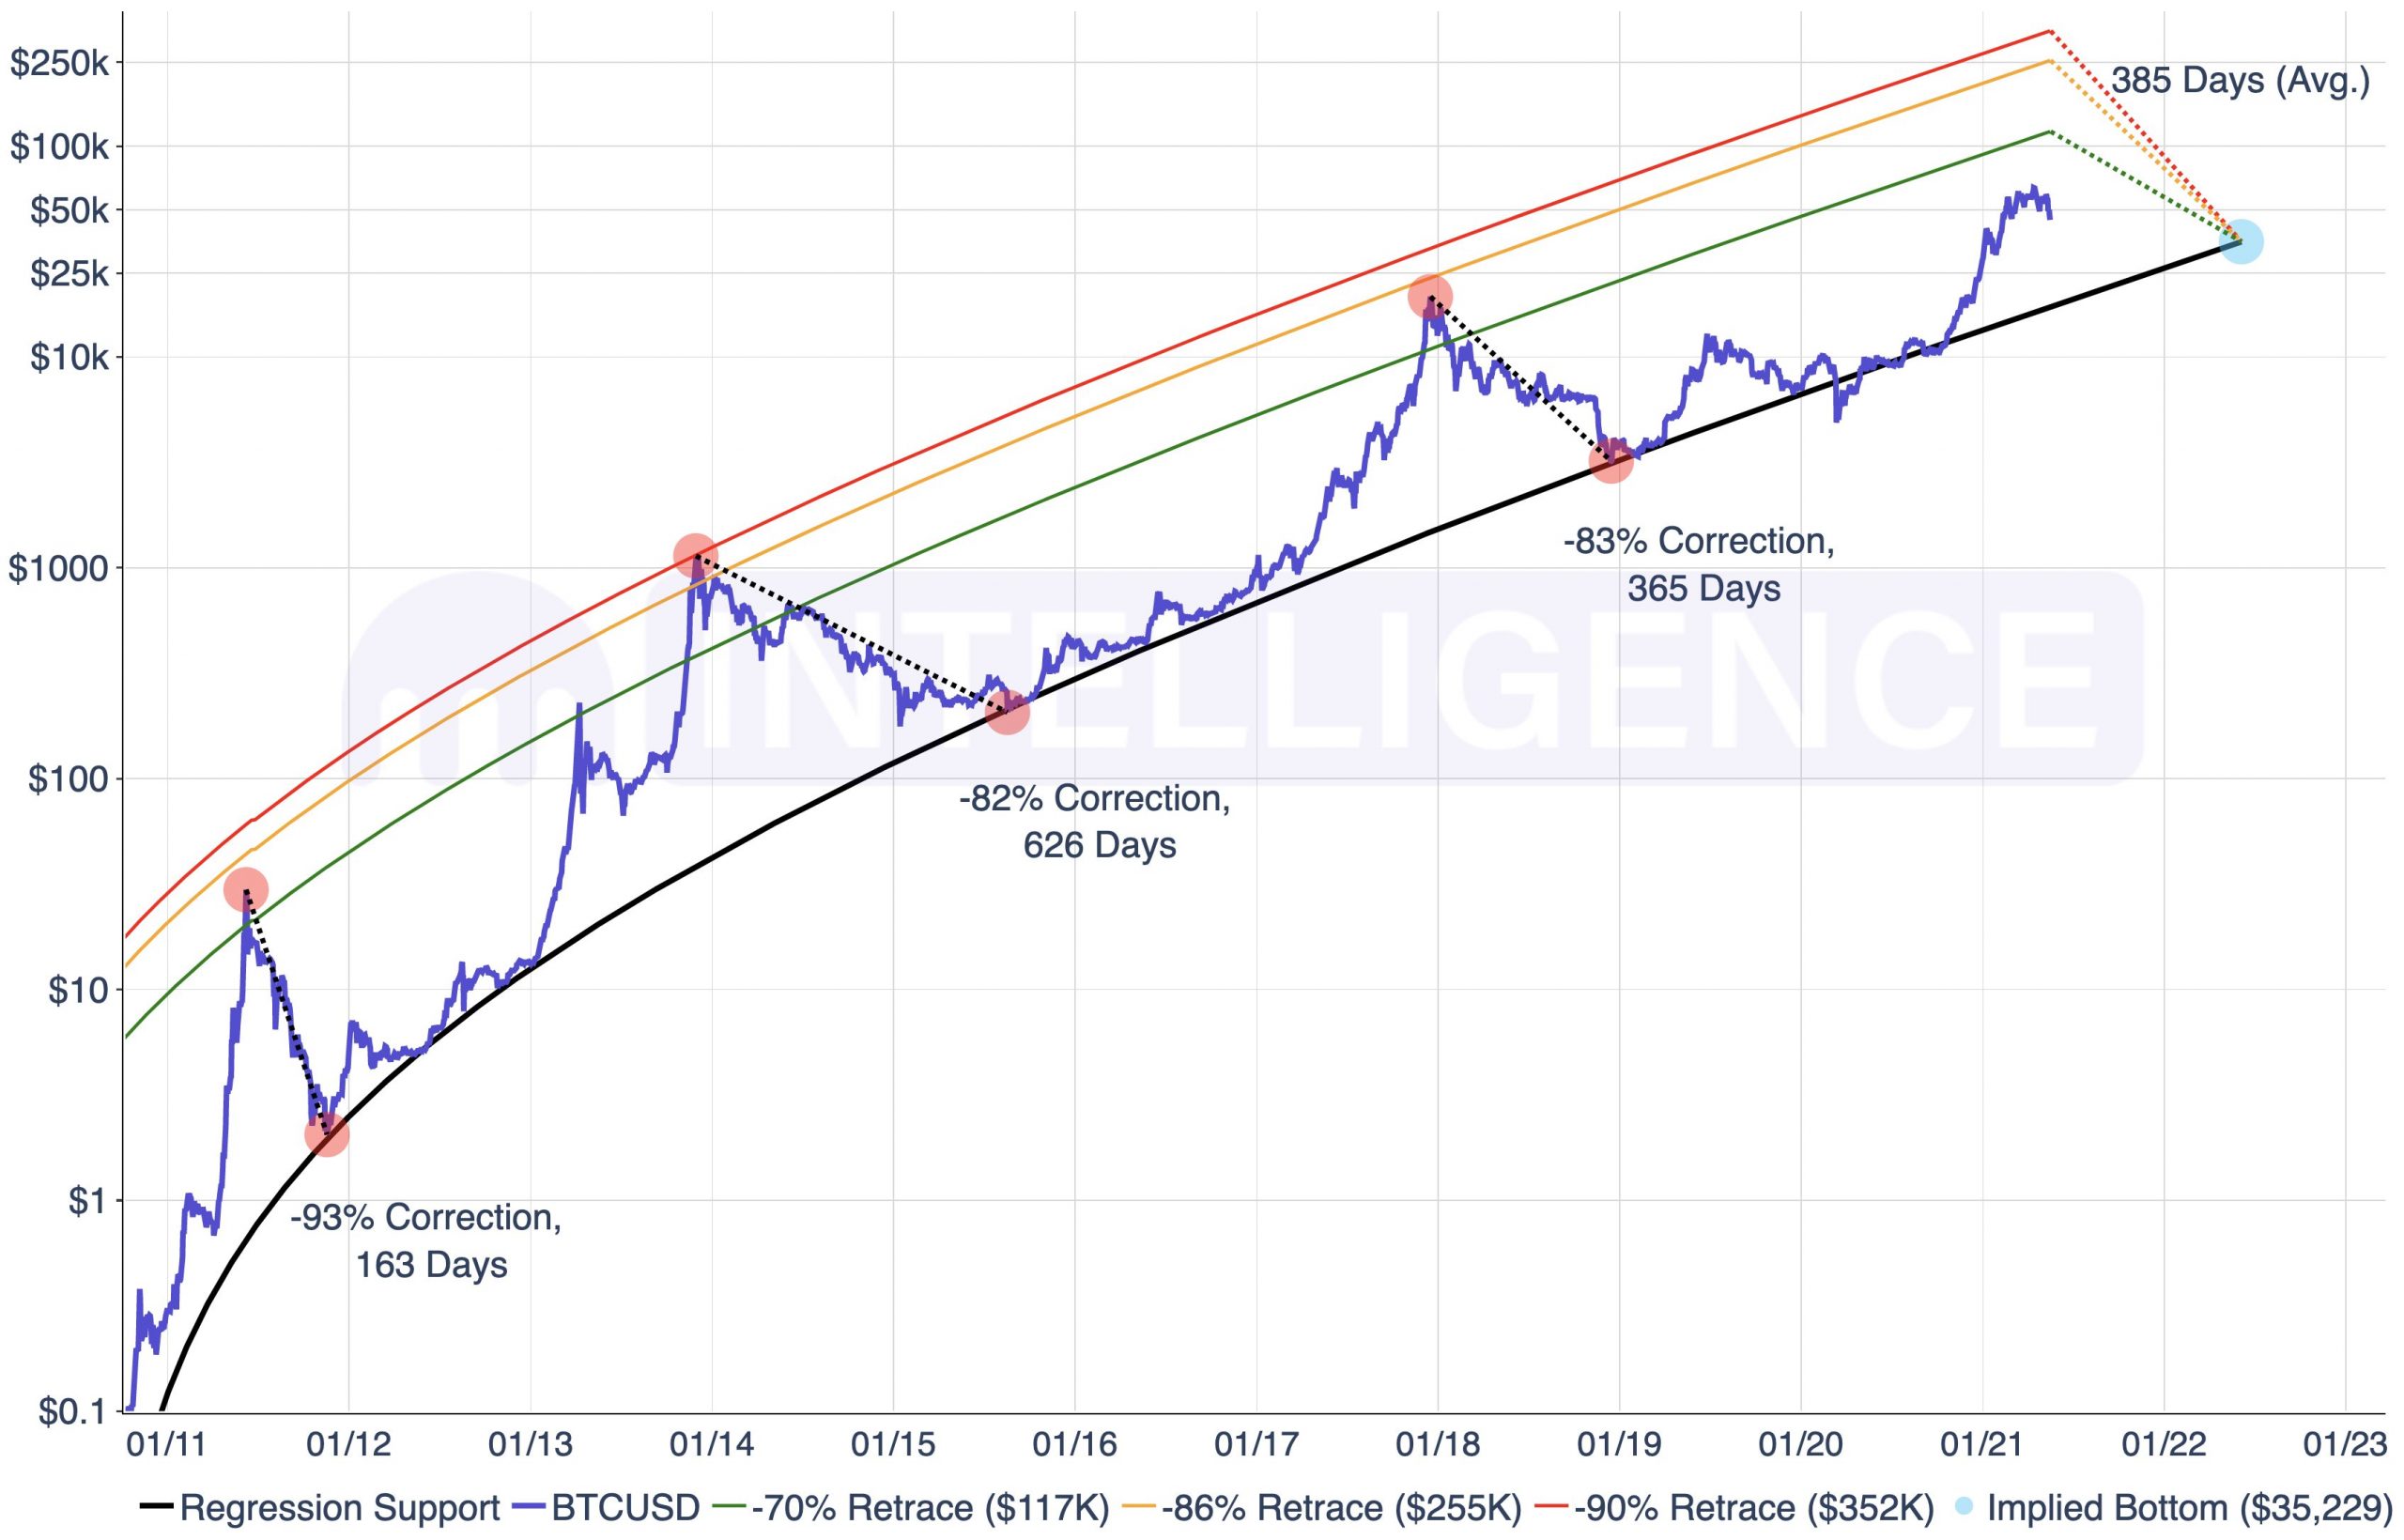
BTC’s logarithmic retracement curve uses the growth curve’s uptrending support line and historical price action to back into an implied market cycle top.
-
Since 2011, BTC has long respected the growth curve’s support line and has historically retraced down to said level upon hitting a market cycle top.
-
When considering BTC’s previous bull market cycles, one will find that it takes, on average, 385 days for BTC to retrace back down to the support band after hitting a top.
-
Also, one will find that BTC has corrected, on average, -86% after the bull market ends.
-
By knowing where the price of the support curve is 385 days from today and making assumptions about how severe BTC will correct after hitting a cycle top, one can have a better sense as to where BTC would need to be trading to correct down to the support band over a period of 385 days.
What You Should Know:
-
The price of BTC’s logarithmic growth curve support 385 days from today is $35,229.
-
Assuming BTC corrects -70% this market cycle, BTC would need to be trading at $117K for BTC to retrace down to support 385 days from today.
-
An -86% correction implies a $255K cycle top and a -90% correction implies a $352K cycle top.
-
According to this model, BTC is not currently in “market cycle top” territory.

How To Read This Chart:
-
Bollinger Bands: A technical indicator that can be used to measure volatility and identify “overbought” or “oversold” conditions. When trading above the upper band, an asset can be considered “overbought.” If trading below, the asset is considered “oversold.” Oftentimes, the upper and lower Bollinger band represents a +/- 2 standard deviation move from a 20-period moving average. However, we’ll be keeping an eye on a +4.5 standard deviation upper Bollinger band relative to BTC’s 20-month moving average.
-
Relative Strength Index (RSI): One of most popular and widely used momentum oscillators. It measures over a 14-period duration and fluctuates between 0 and 100. A reading below 30 indicates “oversold,” a reading over 70 signals “overbought.” Given its historical relevance, we’ll be focusing on BTC’s 14-month RSI.
What You Should Know:
-
BTC’s current intramonth high of $59,603 came $38,286 short of crossing its monthly upper Bollinger band of $97,889.
-
BTC’s 14-month RSI is currently 69.9 and is in “neutral” territory for the first time since October 2020. The trend in BTC’s monthly RSI appears to be akin to 2013 when the index entered into “overbought” territory, then “neutral” territory, and then back into “overbought” territory upon BTC’s second parabolic uptrend of 2013.
-
In April 2013, November 2013, and December 2017, BTC hit an intramonth high above its monthly upper Bollinger band as price set a market cycle top. Only in these 3 instances have we seen BTC break through its +4.5 standard deviation monthly upper Bollinger band. BTC’s 14-month RSI also topped out well into “overbought” territory at a reading of 96.
Bitcoin’s MVRV Z-Score

How To Read This Chart:
-
What Is A Z-Score? A numerical measurement that can explain a value’s relationship to a group’s average. It is measured in terms of standard deviations. For example, a z-score of 0 means that a value is identical to the mean and a z-score of 1.0 means that a value is one standard deviation above the average.
-
BTC’s MVRV Z-Score: Considers BTC’s market value and realized value to help determine when BTC may be over/undervalued. A z-score between 7 and 11 (pink box) suggests BTC is “overbought.” When between 0.9 and -0.3 (green box), BTC is believed to be “oversold.”
-
MVRV Z-Score Formula: (Market Value – Realized Value) / (Std. Deviation of Market Value).
-
Market Value: BTC’s price multiplied by coins in circulation, i.e. market cap.
-
Realized Value: The price of each BTC when it was last moved.
What You Should Know:
-
BTC’s current MVRV z-score is 2.94, down -1.7% from yesterday’s reading of 2.99, down -28.1% from last week’s reading of 4.09, and now at a 5-month low. The last time BTC’s MVRV z-score was this low, BTC was trading at $19,400.
-
BTC’s market value is down -2.3% at $893B and its realized value is unchanged at $377B.
-
A +138.1% increase in BTC’s z-score would put the indicator in “overbought” territory. A -69.4% correction would put the indicator in “oversold” territory.
-
Prior z-score tops:
-
April 9, 2013: 11.05
-
November 23, 2013: 10.8
-
December 8, 2017: 9.77
-
Average score: 10.54
-
Note: These z-score readings topped out 1 day, 7 days, and 11 days, respectively, ahead of a market cycle top.
-
-
On February 21, 2021, BTC’s z-score hit a 3-year high of 7.62.
Bitcoin’s Stock-to-Flow Ratio

How To Read This Chart:
-
Much like gold and silver, we can consider BTC’s circulating supply (stock) against its expected production of new supply (flow) to get a stock-to-flow ratio.
-
A high stock-to-flow ratio implies that a commodity is growing increasingly scarce and more valuable as a result.
-
By overlaying BTC’s price against its stock-to-flow ratio, one will find that BTC’s price has trended alongside the ratio over the years.
-
One will also find that BTC’s price continues to diverge less and less from its stock-to-flow ratio, which is a 365-day average; when price trends above the stock-to-flow ratio, the divergence is positive (>1) and thus BTC may be considered “overbought.”
-
The multi-colored line denotes the number of days until Bitcoin’s next halving, which is when the mining reward for a new block is cut in half. This reduction in new coins (flow) drives BTC’s stock-to-flow ratio higher, implying that BTC is scarcer and thus more valuable.
What You Should Know:
-
Bitcoin is 1078 days out from its next halving, at which point its block reward will fall from 6.25 BTC to 3.125 BTC.
-
BTC’s current divergence is 0.46, down from yesterday’s reading of 0.47 and down from last week’s reading of 0.56.
-
Prior market cycle tops coincided with a divergence reading of 40.8 (June 2011), 9.8 (April 2013), 9.75 (December 2013), and 3.5 (December 2017).

