While Ethereum (ETH) continues to weaken and can only recover slightly from its weekly lows, competitors Cardano (ADA) and Solana (SOL) show a much stronger recovery from their weekly lows.
Ethereum (ETH): Underperformance continues
- Rate (ETH): 1,863 US dollars (USD) (previous week: 2,328 US dollars USD)
- Resistances / Targets: $ 1,930, $ 2,022 / 2,050, $ 2,147, $ 2,263, $ 2,471, $ 2,639, $ 2,886, $ 2,982, $ 3,198, $ 3,568, $ 3,715, $ 3,976, $ 4,374
- Supports: $ 1,820, $ 1,783 / $ 1,755, $ 1,664, $ 1,545, $ 1,489, $ 1,425, $ 1,296, $ 1,049, $ 984, $ 922, $ 769, $ 544
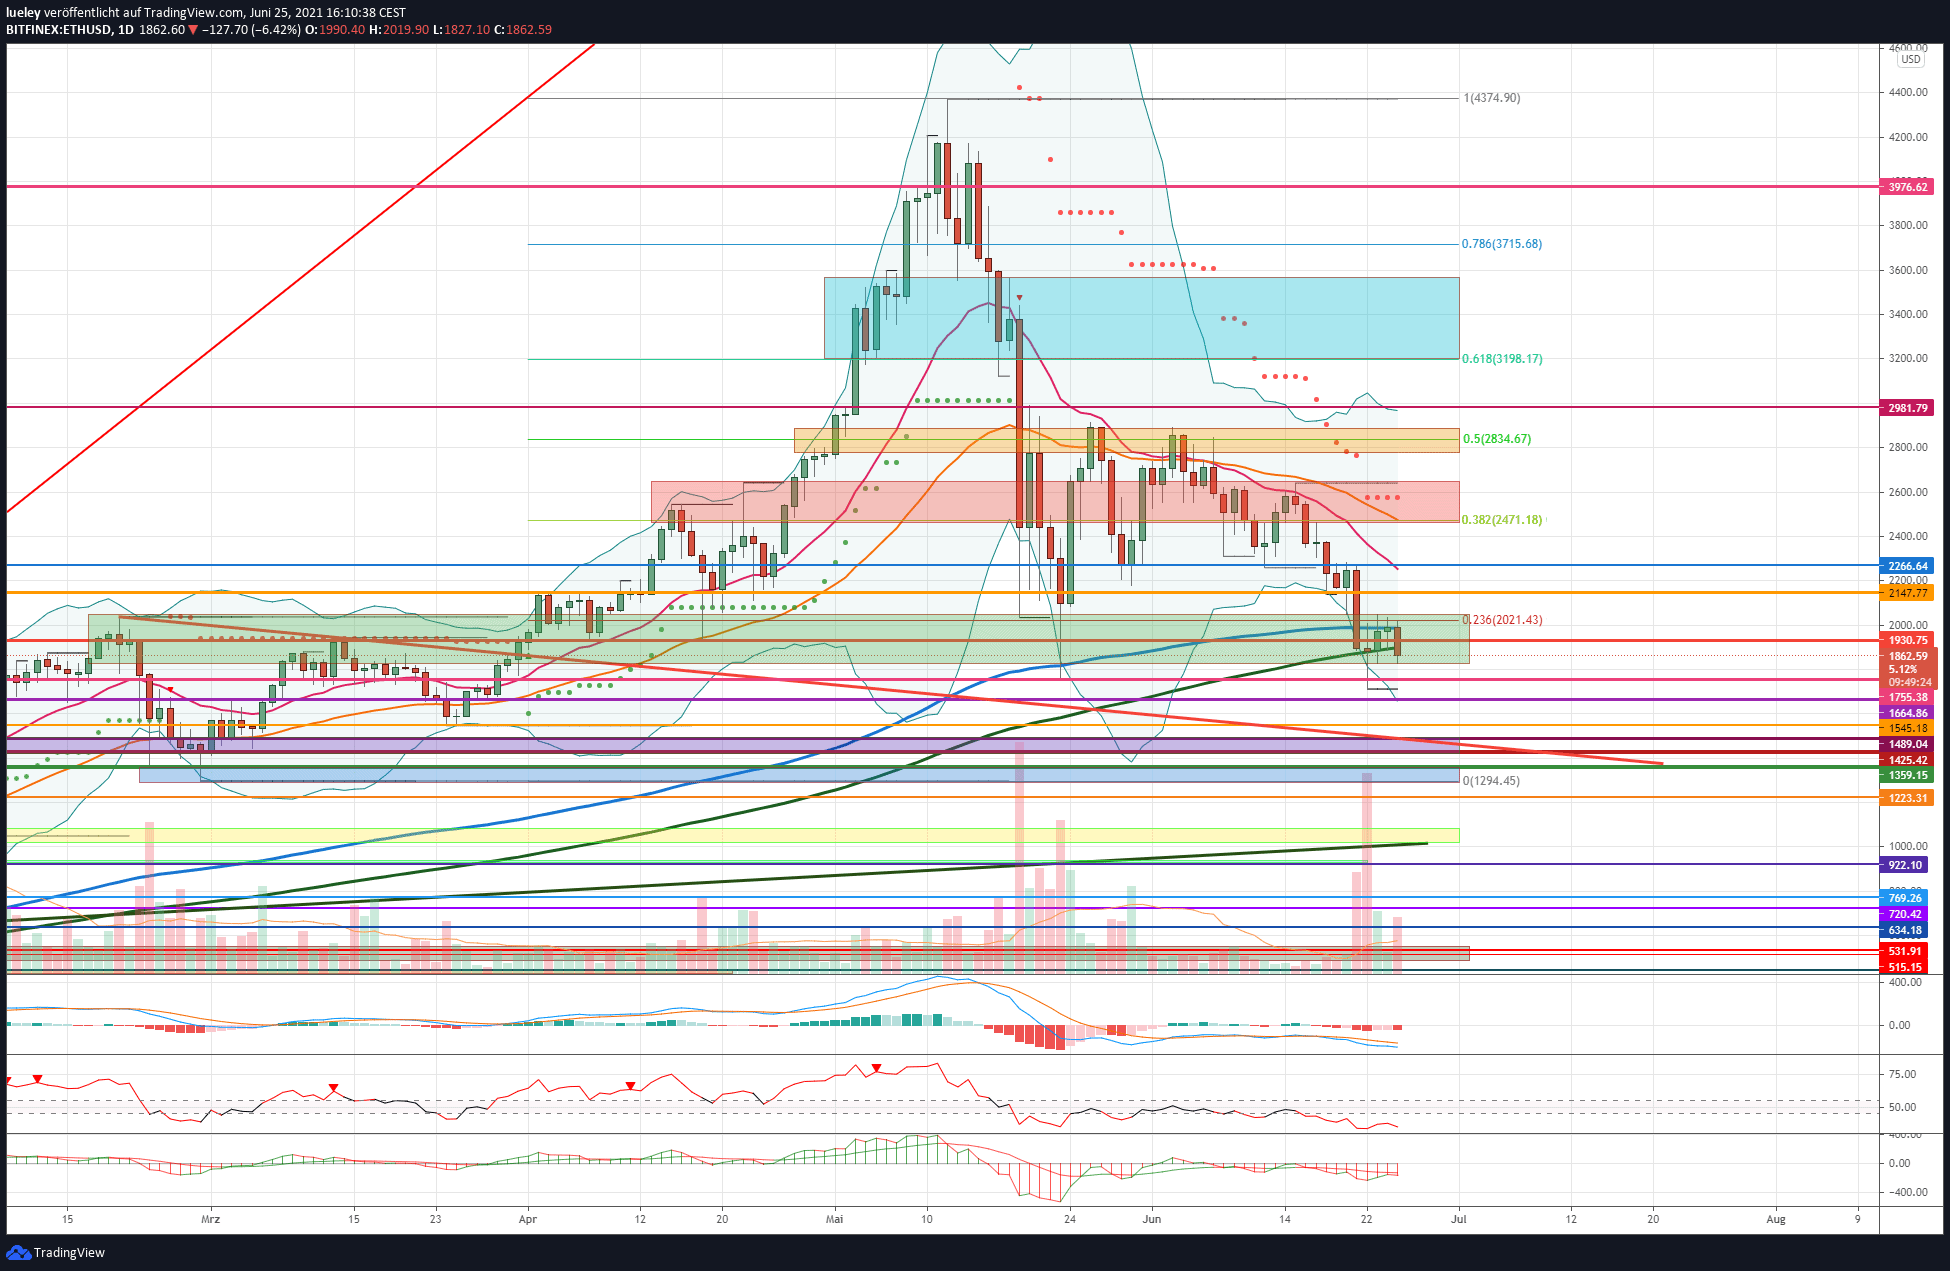
Price analysis based on the value pair ETH / USD on Bitfinex
Bullish variant (Ethereum):
Ethereum also fell to a new multi-month low in the wake of the sharp setback in the crypto key currency Bitcoin (BTC). Although the price subsequently recovered to the 23rd Fibonacci retracement, it failed to initiate a sustainable rebound. In the last hours of trading, the ether price drops again and threatens to resume the bearish movement of the last few weeks of trading. A first positive sign from the bull side would be a daily closing price above USD 2,050. If Ethereum can overcome this resistance level and break the USD 2,147 above, an increase to the cross resistance of EMA20 (red) and horizontal resistance at USD 2,266 is likely. A directional decision is made at short notice. If the bulls manage to regain this price level, a reversal to the next multiple resistance at USD 2,471 is conceivable. In addition to the 38 Fibonacci retracement, the EMA50 (orange) can also be found here. In addition, the supertrend in the daily charts, which is also a strong hurdle, is just in the red resistance area.
Only a daily closing price above the high of June 15 at USD 2,639 should provide clear recovery tendencies and enable further upside potential. If the breakout from the red resistance area succeeds, the 50s Fibonacci retracement at USD 2,834 moves into the focus of investors as a price target. If the ether price can then rise towards USD 2,886 and also break through the resistance level, the chart will brighten further.
The rocky road back towards the all-time high
The maximum price target for the coming weeks is USD 2,981. In addition to the May 20 rebound high, this is also where the upper Bollinger Band runs. Should a recapture of USD 2,981 subsequently occur, a march through to the 61 Fibonacci retracement at USD 3,198 should be planned. Only when the bulls can muster the strength to regain this level of resistance will a further sustained price increase be possible. If Ethereum can penetrate to the upper edge of the blue resistance area at USD 3,568, there are further opportunities for increases up to the 78 Fibonacci retracement at USD 3,715. The bulls will then attempt to attack the resistance at USD 3,976. For the time being, a breakthrough of this resistance level is not expected in the coming weeks, which is why this price level acts as the maximum price target on the upside. The battered chart situation does not allow a prompt rise back to the all-time high at USD 4,374 for the time being.
Bearish variant (Ethereum)
The ether price was only able to recover from its low point to a limited extent. If the bears manage to push the ether price back below USD 1,930 to the weekly low at USD 1,711, a widening of the correction is quite likely. If the bears manage to generate a new weekly low, the correction will initially expand into the range between USD 1,664 and USD 1,545. Here you can find the lows from March 2021 as well as the red downward trend line from the high from February 2021. Should Bitcoin also dip below USD 30,000 again, the ether price is likely to fall back into the purple support area. This runs between USD 1,489 and USD 1,425 and has had a halting effect several times in the past.
If the ether price cannot sustainably stabilize here, a correction expansion into the blue support area at USD 1,296 is also conceivable. As a result, the chart continues to cloud over. The next bearish price target is then USD 1,049. In the area of the yellow support zone there are several lows from January 2021 as well as the overarching green upward trend line. If the bulls do not come back into the market sustainably, Ethereum will correct up to at least USD 922. In the medium term, a correction of up to USD 769 and USD 720 can no longer be ruled out. The gray support zone between USD 544 and USD 489 acts as the maximum bearish price target. However, as long as the ether price can stay above the green overarching upward trend line,
Indicators (Ethereum)
The RSI as well as the MACD indicator continue to trend weak and have sell signals active. The RSI is trading below 45 this week, also a sign of weakness. The sell signals in the weekly chart also underpin the current bearish trend.
Solana (SOL): Solana is recovering faster than the overall market
- Price (SOL): 30.49 USD (previous week: 36.68 USD)
- Resistances / Targets: $ 31.44, $ 32.97, $ 34.04, $ 35.33, $ 38.75, $ 41.82, $ 43.38, $ 44.16, $ 47.89, $ 49 .98 USD, 58.20 USD, 73.21 USD, 82.36 USD
- Supports: US $ 28.38, US $ 25.53, US $ 23.71, US $ 20.11, US $ 19.11, US $ 18.20, US $ 16.66, US $ 12.54
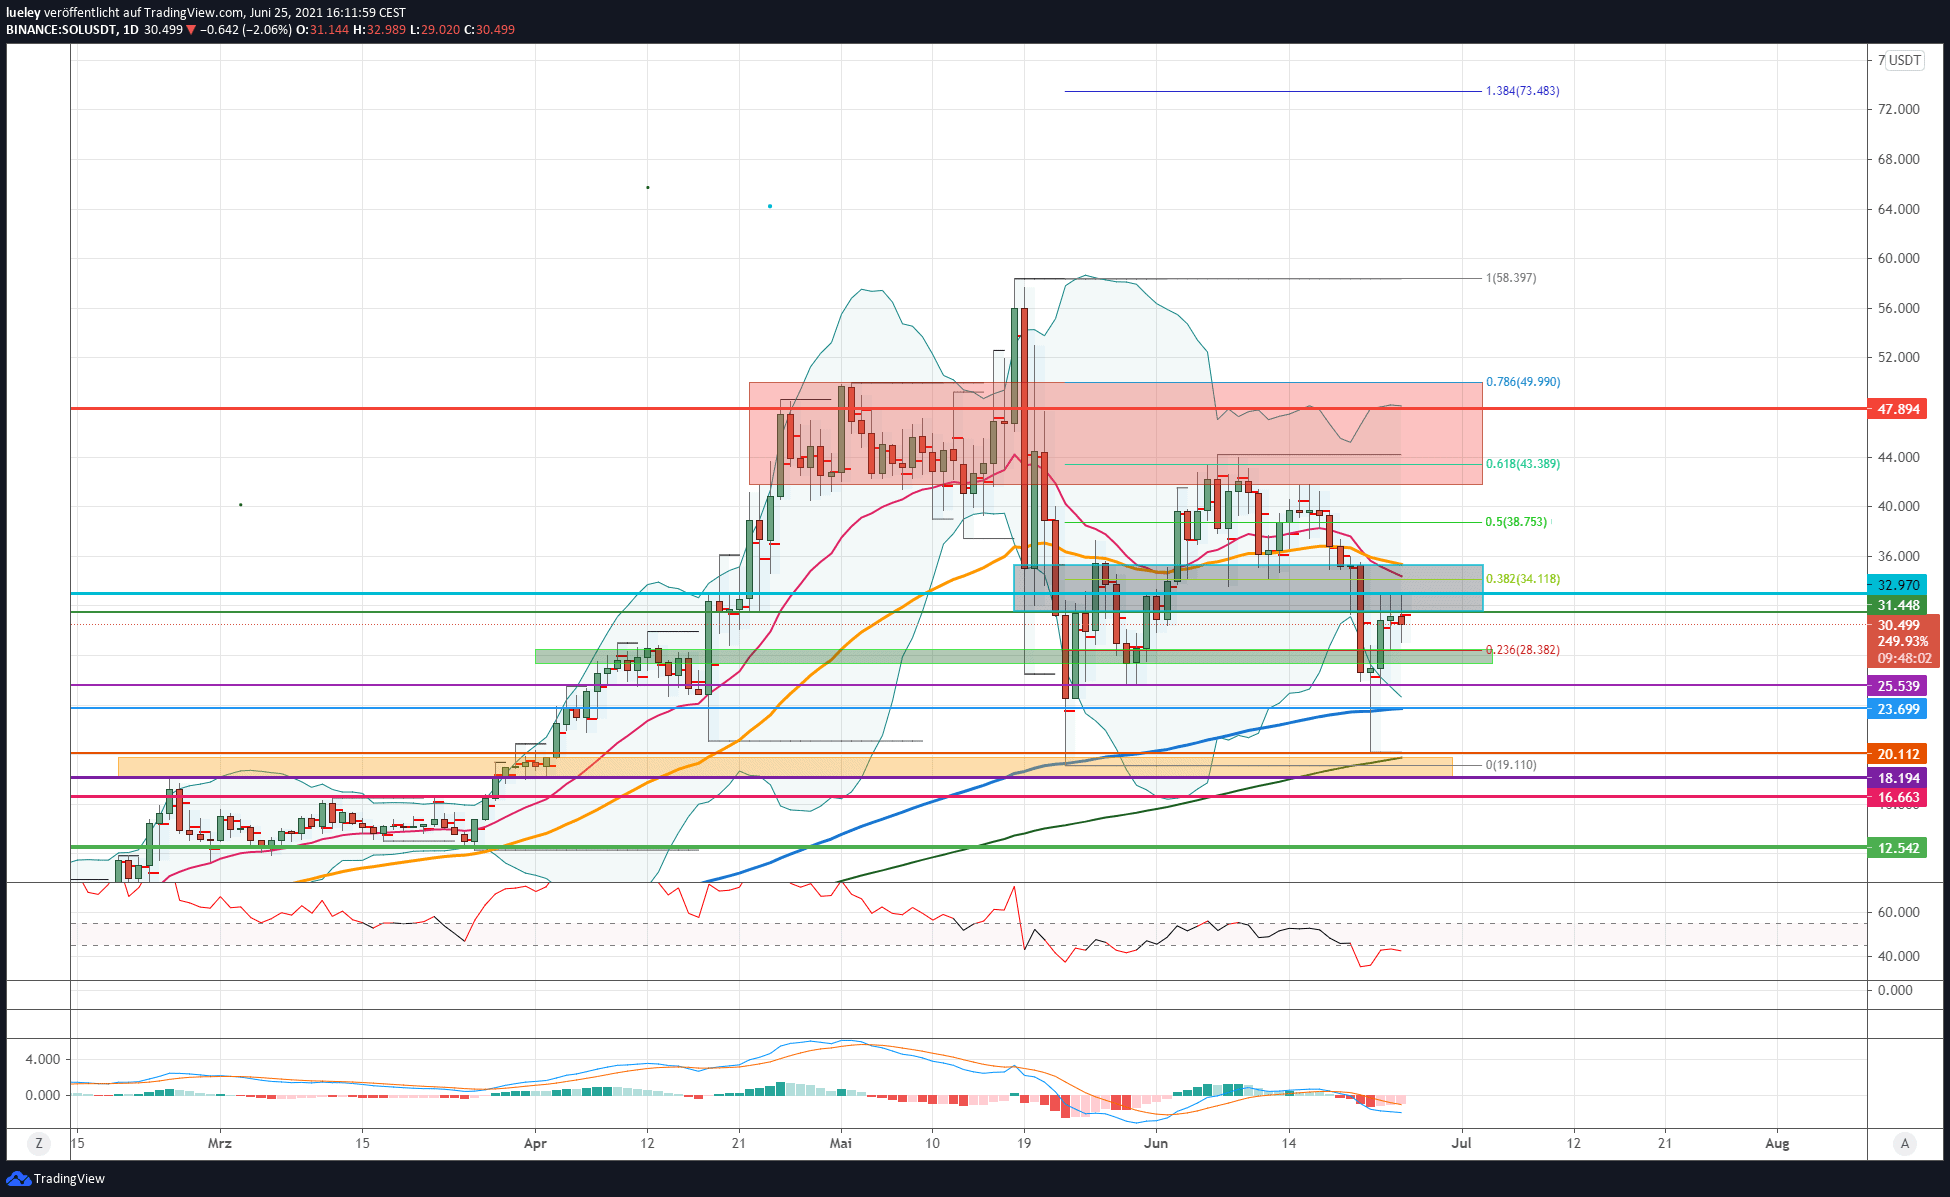
Price analysis based on the value pair SOL / USD on Binance
- SOL price can hold its own but is also trading below the EMA20 (red).
- $ 34.11 as first major resistance for the bulls.
- $ 25.53 acts as key support for the short term.
Since the crash on the overall market, Solana has been able to recover significantly better than many of its competitors. The SOL price bounced north above the MA200 (green) and achieved a remarkable reversal of 62 percent from its weekly low of USD 20.11. Only in the gray resistance area at USD 32.97 did the bulls abandon their strength and let the Solana consolidate back below USD 30 to currently USD 29.44 on Friday, June 25th. As long as the SOL price does not drop below USD 25.53 on the daily closing price, the bulls will try again to initiate a new upward movement towards the EMA20 (red) at USD 34.11.
Bullish variant (Solana)
The countermovement by Solana is to be regarded as remarkable when considering the corrective tendencies in the market as a whole. The SOL course was able to make up for its temporary price losses significantly better than the market as a whole. As long as Solana cannot rise back above the resistance area of EMA20 (red), EMA50 (orange) and the upper edge of the gray resistance zone, a renewed downward movement cannot be ruled out here either. Like the market as a whole, Solana is once again tending south on Friday. If the situation calms down and the SOL price can stabilize sustainably above the moving average lines EMA20 (red) and EMA50 (orange), the 50s Fibonacci retracement comes back into focus as the first price target. If the bulls manage to lift the SOL price dynamically above this resistance level at USD 38.75,
If Solana overcomes USD 41.82, the area around the 61 Fibonacci retracement comes back into focus. If the USD 43.38 is broken through dynamically and the high at USD 44.16 is overcome, the upper Bollinger Band at USD 47.89 becomes the target mark. If this resist is also overcome in the coming trading weeks and the upper edge of the red resistance area at USD 49.98 is broken, the probability of a break through to the all-time high at USD 58.20 increases noticeably. For the time being, this chart mark is to be rated as the maximum price target. Only when the overall market recovers sustainably would an increase up to the 138 Fibonacci extension at USD 73.48 be considered in the coming months.
Bearish variant (Solana)
In the last few days of trading, the bears prevented the retaking of the 38 Fibonacci retracement several times. Again and again the SOL price bounced off in the area of 32.97 USD. If the bears manage to push the price of Solana again below the 23 Fibonacci extension at USD 28.38, a resumption of the corrective movement should be planned. If the green support zone is given up on a sustained basis, the correction should extend to the horizontal support line at USD 25.53. Here the cops will try again to stabilize the SOL course. However, if Solana continues to trend bearish subsequently, a further setback can be expected. The probability of a retest of the EMA200 (blue) at USD 23.71 then increases noticeably. If Solana falls below this support at the daily closing rate,
Indicators (Solana):
The RSI tends to be below 45 on a daily basis and thus shows a sell-signal. The same applies to the MACD indicator. Only a recapture of USD 35.33 should be able to provide new bullish impulses for both indicators.
Cardano (ADA): ADA course after a break-in with another attempt to climb
- Price (ADA): 1.32 USD (previous week: 1.40 USD)
- Resistances / Targets: $ 1.40, $ 1.48, $ 1.61, $ 1.74, $ 1.82, $ 1.92, $ 2.25, $ 2.46, $ 2.77
- Supports: 1.25USD / 1.19 USD, 1.10 USD, 1.00 USD, 0.93 USD, 0.82 USD, 0.75 USD, 0.70 USD, 0.58 USD

Price analysis based on the value pair ADA / USD on Bittrex
- ADA price can break away from its lows after relapsing into the orange support area
- The battle for 1.40 USD will decide the course of the coming weeks.
- Resistance at USD 1.61 to be seen as short-term target price.
The Cardano price collapsed significantly in the course of the overall market correction and fell back to its low of USD 1.00 percentage points. A countermovement set in at USD 1.00 back to USD 1.40. Here Caradano rebounded south on today’s trading day and is trading at 1.30 USD at the time of this analysis. Like Solana, Cardano can recover more than its competitor Ethereum.
Bullish variant (Cardano)
Like all other cryptocurrencies, Cardano fell back in the wake of the Bitcoin weakness to the low of May 19 at USD 1.00. Based on this support, the ADA rate rose by 40 percent to the north before the bears hit back again. Now the bulls have to prove that the countermovement was not only technical in nature, but that they can heave the course back over the cross-resistance of the red downtrend line and EMA20 (red). If the bulls manage to stabilize Cardano sustainably above USD 1.40 and also overcome the EMA50 (orange) at USD 1.48, an increase to the upper edge of the green resistance area is conceivable. The cross resistance from the high of June 15 and the supertrend in the daily chart runs here. If a breakout above this resistance level succeeds, the purple resist zone between USD 1.74 and USD 1.82 moves back into the focus of investors.
The 127 Fibonacci extension at USD 1.77 also runs in this zone. If the bulls can break the USD 1.82 daily closing price, a directional decision will be made in the USD 1.92 area. If this price mark is surpassed sustainably, the area around USD 2.25 will initially come back into the focus of investors. At this resistance level in the form of the 161 Fibonacci extension, the bulls will have to prove themselves again. If Cardano overcomes this resistance level at the daily closing price, a price increase up to the all-time high of USD 2.46 is conceivable. In the short term, the all-time high should be mentioned as the maximum price target on the upside. Only when Bitcoin regains its strength significantly, the ADA price could aim for the next price target of USD 2.77. This chart mark is derived from the 200 Fibonacci extension.
Bearish variant (Cardano)
The bear camp showed its claws this trading week and caused a slump to the strong support level at USD 1.00. There was a clear countermovement here. This led Cardano back to around USD 1.40. This chart mark saw the first profit-taking again on Friday, June 25th. If the bears manage to push the ADA rate back below USD 1.25 and USD 1.19 at the end of the day, there will be another acid test in the USD 1.10 area. There is a cross support from the 78 Fibonacci retracement and EMA200 (blue). If the correction on the market as a whole picks up again, a renewed fallback to the weekly low of USD 1.00 is to be expected.
If this support mark from MA200 (green) and progressive low is also given up, the lower edge of the orange support area comes into view. The bulls should not give up support at USD 0.93. If the daily closing price falls below the low of April 23, the selling pressure increases further. A abandonment of the USD 0.93 should have Cardano corrected up to USD 0.81. If this price mark does not stop either, the correction extends into the yellow support zone between USD 0.75 and USD 0.70. If the 50th Fibonacci retracement is also broken dynamically at the daily closing price, a fallback to the maximum bearish price target of USD 0.58 cannot be ruled out. However, as long as Bitcoin can hold its own above USD 30,000,
Indicators (Cardano)
The RSI as well as the MACD indicator show a sell signal on a daily basis. With a value of 44, the RSI indicator is trading just below the neutral zone. A break above USD 1.40 should push the RSI back into the neutral zone between 45 and 55. In the weekly chart, too, both indicators show clear signs of weakness. The MACD indicator generated a fresh sell signal this trading week.