Bitcoin (BTC) can digest the previous week’s sales well for the time being and is rising noticeably northwards again in the last hours of trading. Bitcoin dominance can also avert the formation of a new annual low for the time being.
Bitcoin (BTC): The cops are far from defeated
BTC rate : 47,819 USD (previous week: 46,500 USD)
Resistances / Targets: $ 48,222, $ 50,325, $ 51,307, $ 53,005, $ 54,077, $ 55,817, $ 57,998, $ 59,470, $ 61,771, $ 64,896, $ 67,416, $ 69,660, $ 70,856, $ 76,472, $ 77,678
Supports: USD 47,070, USD 46,040, USD 44,878, USD 44,147, USD 42,923, USD 41,321, USD 40,585, USD 39,240, USD 38,537, USD 37,321, USD 36,643, USD 34,899, USD 33,335, USD 32,718, USD 31,603, USD 31,010, $ 30,000, $ 29,300, $ 28,795, $ 27,563, $ 26,404, $ 23,887, $ 22,222, $ 21,892, $ 19,884,


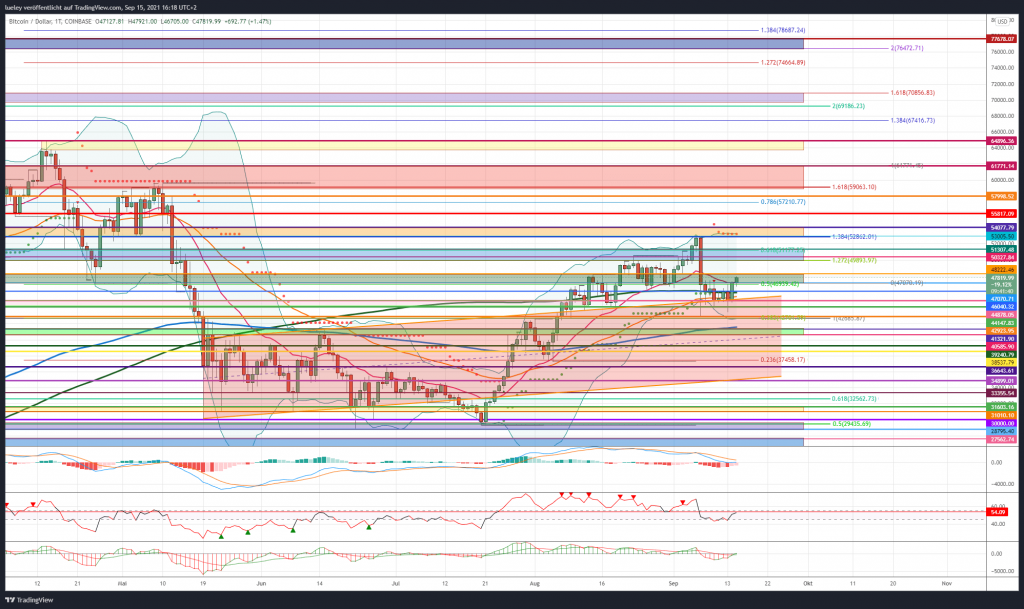
The bulls were able to avert the price slump in Bitcoin for the time being. This Wednesday afternoon, the Bitcoin course is currently trying to recapture the EMA20 (red). If the bulls manage to sustainably overcome this sliding resistance and also break through the next relevant resistance at USD 48,222, the psychologically important mark of USD 50,000 will come into focus again. Many eyes are on September 24th. On this trading day, many bets on Bitcoin expire. The area around 50,000 USD plays an important role here, as this is where the largest number of open contracts can be found, according to the SKEW analysis platform.
Bullish scenario (Bitcoin price)
The Bitcoin bulls do not give up and can counter the sale for the time being. This development shows that the “diamond hands”, especially long-term investors, continue to believe in the price development of Bitcoin. If the buyer’s warehouse manages to stabilize the BTC rate above the EMA20 today, a preliminary decision will be made for the coming trading days in the USD 48,222 area. If this resistance level is regained, an increase to the zone between USD 50,325 and USD 51,307 can be expected in the coming days. However, it will take some effort to break the blue resistance area and march towards USD 53,005 again. With the supertrend and the upper Bollinger band, there are two stronger resistances. Only a dynamic breakout above this resistance opens up room to USD 54,077. This would result in space in the direction of USD 55,817 in perspective. This resistance has historically been very competitive between bulls and bears.
The all-time high in view
If the daily closing price of USD 55,817 is broken, the overarching target price of USD 57,998 comes into focus. Once again, increased profit-taking is to be expected. If this strong resist can also be overcome dynamically, a walk-through of up to USD 59,470 must be planned. If the rally continues to gain momentum in the coming months, USD 61,771 will be significant as the last resistance level before the all-time high. If this price mark is broken, the all-time high will be started. Once again, investors will want to reap profits.
If the USD 64,896 is overcome sustainably, there is initially space up to the 138 Fibonacci extension at USD 67,416. As a result, the bulls should stabilize the price above USD 60,000 so as not to let the rally nip in the bud again. If this project succeeds, Bitcoin should enter the zone between USD 69,660 and USD 70,856. From the current perspective, the maximum price target is still between USD 76,472 and USD 77,678. The fact that the RSI indicator is about to generate a new buy signal should also have a positive effect on the price trend.
Bearish scenario (Bitcoin price)
Once again, the bears failed to maintain the pressure to sell. The recapture of the EMA20 speaks for itself. If the bears fail to cap the BTC rate below USD 48,222, the USD 50,000 area is the last chance for a rate reversal. Only when Bitcoin slides back below USD 47,070 and subsequently also falls below the MA200 (green) at USD 46,040, the bears are likely to lick blood again. A daily closing price below US $ 46,040 increases the chance of a retest of the range between $ 44,878 and $ 44,147.
Here you can find the EMA50 (orange) and the top edge of the trend channel. If this area is permanently abandoned, the USD 42,923 comes back into focus. In addition to the previous week’s low, the lower Bollinger Band can also be found here. Again the cops will try to turn north here. The abandonment of this support makes a correction extension into the green support zone between USD 41,334 and USD 40,585 likely.
From here on it gets bearish
The EMA200 (blue) and highs from June of this year are currently also running here. If Bitcoin undercuts this strong support as well, the downward movement will expand to at least USD 39,240. A direct price decline to USD 38,537 would also be conceivable. Below these levels of support, the bears are back in control and will target the 23rd Fibonacci retracement at 37,321. The correction could even lead Bitcoin immediately to $ 36,643. If the weakness in the crypto market continues, a setback to USD 34,899 or even USD 33,355 is conceivable. The 61’s Fibonacci retracement runs here, which is a strong support.
If the bulls do not oppose this, Bitcoin could also want to reach USD 31,603 in the medium term. Surrendering this support will extend the corrective move towards the mid-term target area between $ 31,010 and $ 30,000. In the first attempt, the purple support area should represent the maximum price target on the bottom. Only when the low of June 22nd at USD 28,795 is broken sustainably, price targets at USD 26,399 or below should be planned in perspective.
Bitcoin dominance: ricochet off resistance zone


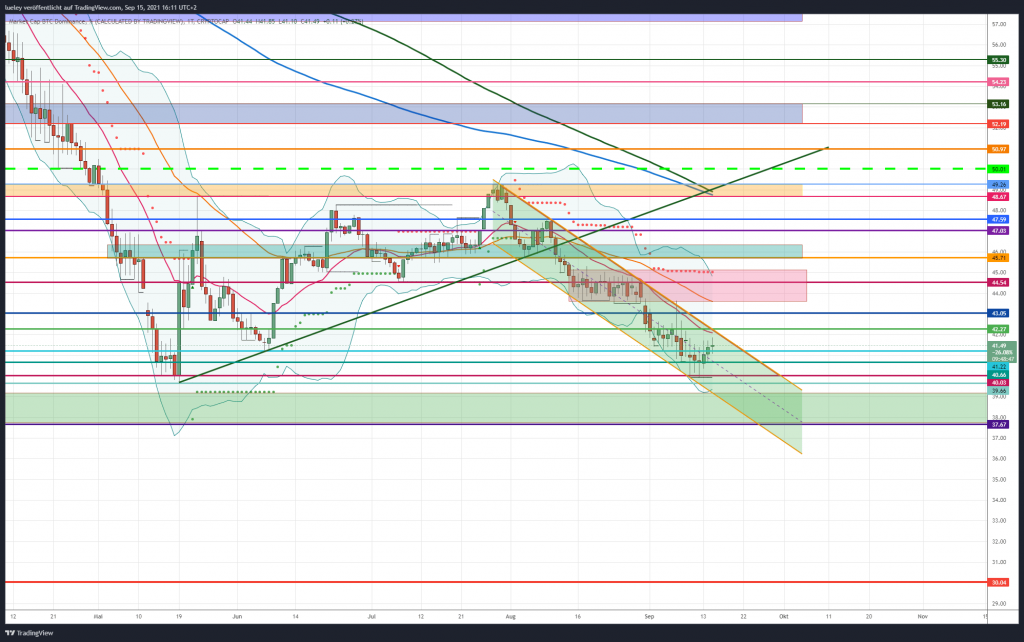
After a relapse to key support at 40.03 percent last weekend, Bitcoin dominance can initially recover and rise back over 40.66 percent and 41.22 percentage points. This averted a slump below the annual low of May 18, 2021 for the time being. BTC dominance is currently trying to target the upper edge of the established downtrend channel. A preliminary decision is likely to be in the area of 42.27 percent. Three relevant resistances run here with the EMA20 (red), the upper edge of the trend channel and the horizontal resistance line.
BTC Dominance: Bullish Scenario
The dominance of the crypto reserve currency was able to avert a crash to new annual lows for the time being. Starting from 40.03 percent, the BTC dominance recovered by more than four percentage points in the last four trading days. This brings the multiple resist back into focus in the area of 42.27 percent. If the BTC dominance succeeds in closing the day’s closing price above 42.27 percent, a subsequent increase up to the area of 43.05 percent should be planned. It gets exciting at the lower edge of the red box at 43.60 percent. The EMA50 (orange) can currently also be found here.
If the BTC dominance can dynamically overcome this resistance level, the next price target will be activated at 44.54 percentage points. In the recent past, Bitcoin dominance has repeatedly bounced off towards the south. If there is a break above this resistance level, the upper edge of the red box comes into focus at 45.10 percent. Here the supertrend in the daily chart is 45.03 percent. The upper Bollinger Band also has a price-limiting effect here. If this price level can be overcome, resistance at 45.71 percent and 46.33 percent will come into focus as targets.
Only when the 46.33 percent on the day’s closing price is regained should a subsequent increase of up to 47.03 percent or even 47.59 percent be planned. A jump over 47.59 percent is not to be expected at the first attempt. If the BTC dominance can overcome this strong resist in the medium term, a march through to the orange resistance zone is likely. Then the 48.67 percent mark should be targeted in perspective. With the EMA200 (blue) and MA200 (green) there are two strong sliding resistances not far above it. The maximum increase target for the time being is the high from July 2021 at 49.26 percentage points. If there is a recovery above this resistance level in the coming months, the Bitcoin bulls will do everything possible to
BTC Dominance: Bearish Scenario
As long as the Bitcoin dominance cannot break out of the trend channel and bounce down in the area of 42.27 percent, there is still no all-clear in sight. For the time being, the downside risks continue to prevail. If the BTC dominance falls back below today’s low and thus gives up the mark of 41.22 percent again, a retest of the previous week’s low at 40.66 percent is initially likely. If this support level does not stop either, the area comes back into focus by 40 percent. A renewed start to the annual low of 39.66 percent should then be increasingly planned. The dominance of the key crypto currency must show its colors here if an expansion of the correction to the green support zone between 39.21 percent and 37.67 percent is to be averted. If it comes to 37,
Disclaimer: The price estimates presented on this page do not constitute buy or sell recommendations. They are only an assessment of the analyst.
The chart images were created using TradingView .

