Since the rejection of $ 53,000 at the start of the week and the fall that followed, the market has struggled to recover from the flash crash and the bulls are kept their heads under water while the bears maintain the ascendancy. This Sunday, September 12, 2021, Bitcoin (BTC) once again passed an important milestone by closing its daily candle above the support level of the $ 46,000 area after hitting $ 44,742 on Binance at the lowest of the day. Buyers absolutely need to maintain this critical support for this new week.
Weekly closing under the sign of the bears
This week, the day that was supposed to be a bright day for Bitcoin (BTC) with its adoption as legal tender in El Salvador, was marked by the largest market price capitulation since May.
Cryptocurrency’s worst day in four months was marked by its $ 330 billion in market capitalization soaring in just half a day.
Since last Tuesday’s flash crash in which Bitcoin (BTC) lost more than $ 10,000 in a matter of hours, the price of virtual currency has remained stable, placing itself in the area below crucial moving average support at 200 days.
After falling from the $ 53,000 area to $ 42,843 on Binance, Bitcoin (BTC) immediately rebounded to its critical low area before consolidating around the 200-day average.
A range followed throughout the week between the $ 44,000 support and the $ 47,000 that the cryptocurrency failed to break.
This Sunday, September 12, 2021, Bitcoin (BTC) closes its last day of the week just above the 200-day moving average at $ 46,025 on Binance. The latest attempt by buyers this week to try to regain control after several days of bearish dominance.
However, the weekly close remains totally under the sign of the bears with a fall of more than 11% since the opening of the candle. Becoming the most bearish weekly candle since the market fell in May.
What to expect for September 13, 2021?
If Bitcoin (BTC) manages to maintain its course around $ 46,000 and hold its position above the 200-day moving average for the daily close of September 13, that could be the end of this correction and a probable retest of the $ 47,000 area which, if conquered, will begin the recovery of $ 50,000.
Conversely, if the bulls fail to defend their conquest of $ 46,000 and the cryptocurrency is rejected from this level, we risk revisiting the $ 44,000, then the $ 43,000 if this first support does not hold.
If a more severe correction from that point takes place this week, it could drop us all the way down to $ 38,000, which is the area of the 61.8% Fibonacci retracement level from Bitcoin’s all-time high (BTC ).
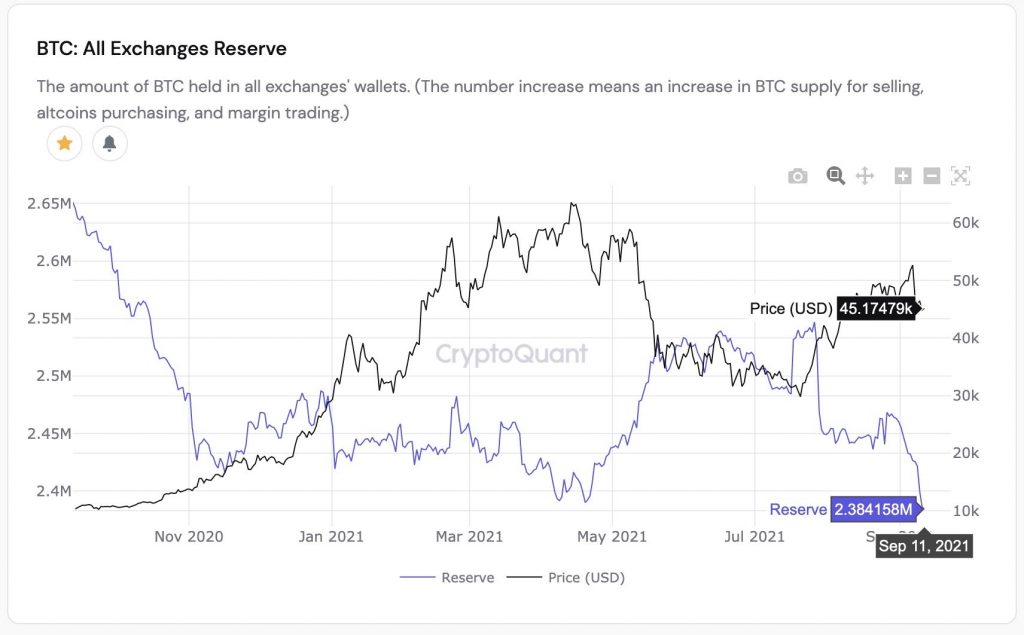
Record: Bitcoin (BTC) reserve on exchanges at its lowest!
The accumulation of whales continues. The reserve of BTC on all exchanges reaches a new record, it is at its lowest for 3 years ! A new sign showing that the market is mostly bullish and that the price should soon show it in the medium term.
On-chain data continues to show that whales are accumulating steadily, long-term holders, and those holding older BTCs continue to accumulate, showing no signs of leaking from the market.
Again, the group that sold are those who had held BTC for 3-6 months and panicked the decline. A group that had accumulated BTC between 50,000 and the peak of Bitcoin.
For Bitcoin miners (BTC), on-chain data shows a return to accumulation after minimal sell-off during liquidation. The total outflows of miners to exchanges for sale have declined dramatically, while the supply of miners has increased.
So, the data continues to favor the bulls, strongly suggesting that this is a small jerk on the way for prices to rise in the coming months.
This week has been the most eventful since mid-May, marking the sudden return of volatility via a crashing fall in Bitcoin (BTC). A decline that represents a market correction one would expect after almost 7 weeks of uptrend. However, if one relies on the on-chain data, the elements remain in favor of the continuation to the rise after this momentary halt. The short-term chart may look scary, but the general trend undoubtedly suggests a rise in price in the weeks and months to come.
Bitcoin price prediction for September 2021.
In the beginning price at 47160 Dollars. Maximum price $59699, minimum price $46361. The average for the month $51877. Bitcoin price forecast at the end of the month $54289, change for September 15.1%.
BTC to USD predictions for October 2021.
In the beginning price at 54289 Dollars. Maximum price $63155, minimum price $48479. The average for the month $56237. Bitcoin price forecast at the end of the month $59023, change for October 8.7%.
Bitcoin price prediction for November 2021.
In the beginning price at 59023 Dollars. Maximum price $71930, minimum price $59023. The average for the month $64300. Bitcoin price forecast at the end of the month $67224, change for November 13.9%.
BTC to USD predictions for December 2021.
In the beginning price at 67224 Dollars. Maximum price $83439, minimum price $67224. The average for the month $73967. Bitcoin price forecast at the end of the month $77980, change for December 16.0%.
Bitcoin price prediction for January 2022.
In the beginning price at 77980 Dollars. Maximum price $78434, minimum price $68172. The average for the month $74472. Bitcoin price forecast at the end of the month $73303, change for January -6.0%.