 Price Forecast, Binance Coin (BNB) Price Prediction 2023, Best time to buy binance coin, where to buy BNB at best price)
Binance Coin (BNB) has been able to recover in the last few trading days and break away from its lows for the year in the short term.
Despite the recent bad news about the departure of several executives from the Binance crypto exchange, the in-house Binance Coin (BNB) has been able to stabilize above the important support area between US$ 231 and US$ 220 for the time being. At the beginning of the week, the BNB price tended to be around six percentage points firmer at currently 246 US dollars. One reason can be seen in the announcement of the new token sale on the Binance Launchpad. Crypto analytics firm Arkham Research is launching its ARKM token exclusively on Binance on July 17. In order to be eligible for the token sale, interested investors have been able to have their BNB coins blocked for the Arkham Launchpad sale for a few hours. In the past, this procedure has already led to increased demand for BNB tokens while the pressure to sell has decreased at the same time.
Editor’s Choice: Smallest blockchain in a daily comparison among the top performers i.e Mina
It remains to be seen whether yesterday’s price movement will only be short-lived or whether it will ensure sustained price stabilization. Despite the recent recovery, the chart picture looks uncertain amid possible further regulatory issues for the largest crypto exchange. From a technical point of view, the price of the Binance Coin must first recapture the yellow resistance area around 254 US dollars in order to ban the risk of another sell-off. A dip below the $239 chart level would bring the purple support zone surrounding the lows of the last few weeks back into focus.
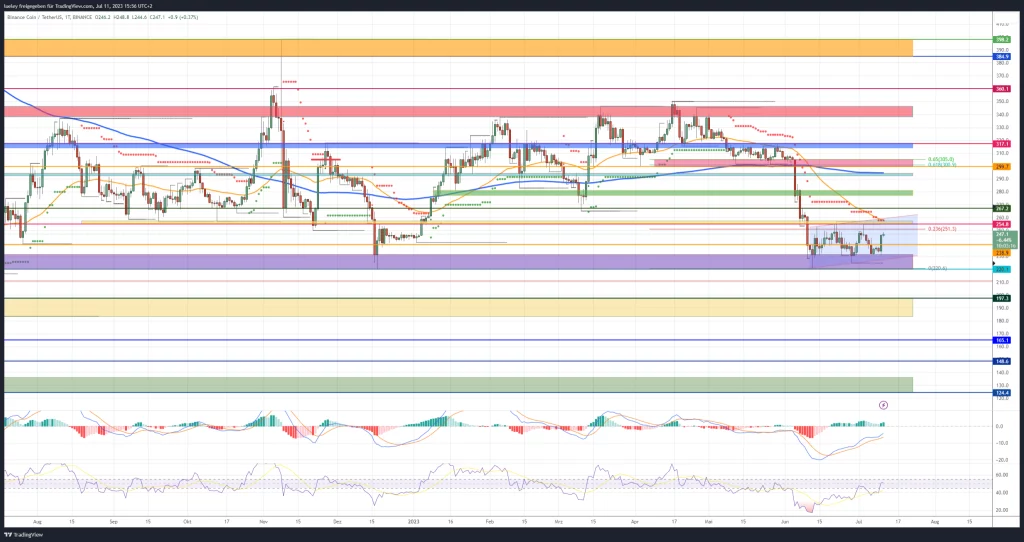
BNB: Bullish price targets for the coming weeks
Bullishes: $ 254/259 , $267, $276/281, $293, $ 301 , $314/317, $338/346
In the past few weeks, the buyer side has managed to prevent a renewed sell-off to the low for the year at 220 US dollars. Despite this resistance, BNB price remains unchanged in a bearish flag formation. The danger of a further sell-off in the coming weeks would only be averted with a dynamic price breakout above the multiple resistance from EMA50 (orange), supertrend and the upper edge of the flag at 257 US dollars. If the bulls succeed in recapturing this area and the BNB price can then recapture the horizontal resistance level at 267 US dollars, a follow-up movement in the direction of the green resist zone is possible.
If the Binance Coin then jumps further north above the USD 281 mark, there will be a short-term preliminary decision at USD 293. The EMA200 (blue) is currently running in the turquoise zone. A breakout above this should lead the BNB price to the old tear-off edge at US$ 301. This is also where the golden pocket of the current recovery movement runs. A price bounce to the south seems likely due to the uncertainty surrounding Binance. If, contrary to expectations, the bulls succeed in a dynamic recapture, a subsequent recovery towards the last highs around US$317 would be conceivable.
The BNB price was unable to overcome this chart mark several times in May. Only if the blue resist zone can be sustainably breached would an upward movement in the direction of the yearly highs between USD 338 and USD 346 be considered.
BNB: Bearish price targets for the coming weeks
Bearish price targets: $239, $231 / $ 220 , $211, $197/$ 183 , $165, $148 /$ 124
As long as the bears can cap the BNB price below the yellow resist zone and thus avert a breakout of the flag, a price pullback must be planned at any time. A drop below the support at 239 US dollars would already significantly increase the probability of a sell-off towards 231 US dollars.
This endorsement mark must not be abandoned by the buyer side. Otherwise, a retest of the low for the year at 220 US dollars threatens. If the price falls below USD 220, a price carnage threatens due to the possible liquidation of a USD 150 million position in the Venus Lending protocol.
As a result, Binance Coin is likely to break straight into the next target range between $197 and $183. Although a technical counter-reaction is to be planned here, the probability of a correction expanding in the coming months of trading would increase significantly. If the BNB price also gives up $165 in the medium term, the Binance Coin could fall back to the support area between $148 and $124.
Looking at the indicators
In the 4-hour chart, the RSI indicator was able to generate a buy-signal recently, but with a value of 69 it is not far from an overbought state. The RSI was also able to recover to the neutral zone between 45 and 55 in the daily chart. Although the MACD indicator is currently showing a slight buy signal, it is still trading below its 0 line. In the weekly chart, both indicators also show slight stabilization tendencies, but continue to trade in bearish territory.