In the ever-evolving realm of cryptocurrencies, XAI has emerged as a compelling contender. As we venture into 2024, investors are buzzing with anticipation, wondering if XAI’s price is destined to reach the $3 milestone soon. Join us as we dissect the factors shaping XAI’s trajectory and explore whether the coveted $3 mark is within reach. Fasten your seatbelts for a quick dive into the future of XAI!
Xai (XAI) Current Market Status
XAI has a circulating supply of 277,118,150 coins, with a maximum supply capped at 2,500,000,000 XAI, as per CoinMarketCap. As of the latest update, the current trading price of XAI stands at $0.5335, reflecting a 26% decrease over the past 24 hours. The trading volume during this period has surged to $280,147,323, indicating a notable 63% increase.
Major cryptocurrency exchanges facilitating XAI trading include Binance, Bybit, BingX, Bitrue, and Bitget.
Having gained insights into XAI’s transaction metrics and its present market conditions, let’s delve into the price analysis for XAI in 2024.
Relative Strength Index (RSI) of XAI – (XAI) Price Analysis Jan 2024
The Relative Strength Index (RSI) serves as an indicator to assess whether a security is currently overvalued or undervalued. This indicator gauges the present performance of the security in relation to its past prices.
Additionally, it features a signal line, represented by a Simple Moving Average (SMA), which serves as a benchmark for the RSI line. Consequently, when the RSI line surpasses the SMA, it indicates a bullish trend; conversely, if it falls below the SMA, it signals a bearish trend.
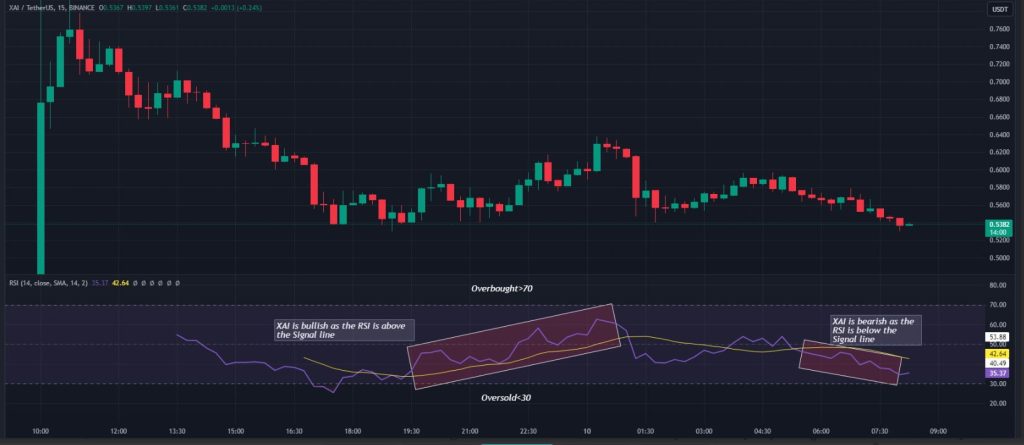
Source: TradingView
The chart above indicates the current oversold direction of the Relative Strength Index (RSI). With an RSI reading of 35, it is precariously close to the oversold region, posing a risk of XAI entering into oversold territory if buyers do not intervene promptly. There is a notable possibility that some buyers may be waiting for XAI to reach its bottom before capitalizing on it.
Simultaneously, the RSI serves as an indicator for detecting divergences. Typically, the RSI follows the trajectory of the cryptocurrency. If the cryptocurrency achieves a higher high, the RSI also attains a higher high. Conversely, a bearish divergence occurs when the cryptocurrency achieves a higher high while the RSI attains a lower high. The opposite holds true for a bullish divergence.
It’s important to note that these divergences can be time-sensitive. A divergence observed in a longer timeframe may not necessarily manifest in a shorter timeframe.
Xai (XAI) Price Analysis 2024
At present, Xai (XAI) holds the 268th position on CoinMarketCap. Can the latest enhancements, additions, and modifications to XAI contribute to an increase in its price? To explore this possibility, let’s delve into the charts presented in this article’s XAI price forecast.
Volume Weighted Average – XAI (XAI) Price Analysis (15 min Chart)
Named for its purpose, the Volume Weighted Average (VWA) serves as an indicator providing an average influenced by both the price and volume of a cryptocurrency. In contrast to the Simple Moving Average, which neglects volume in its calculation, the VWA proves more precise by considering price changes in conjunction with volume fluctuations.
Traders leverage this indicator for strategic market entry and exit decisions. For instance, traders opt for a long position upon observing a cryptocurrency’s price surpassing the VWA. Conversely, if the cryptocurrency dips just below the VWA, they choose to go short.
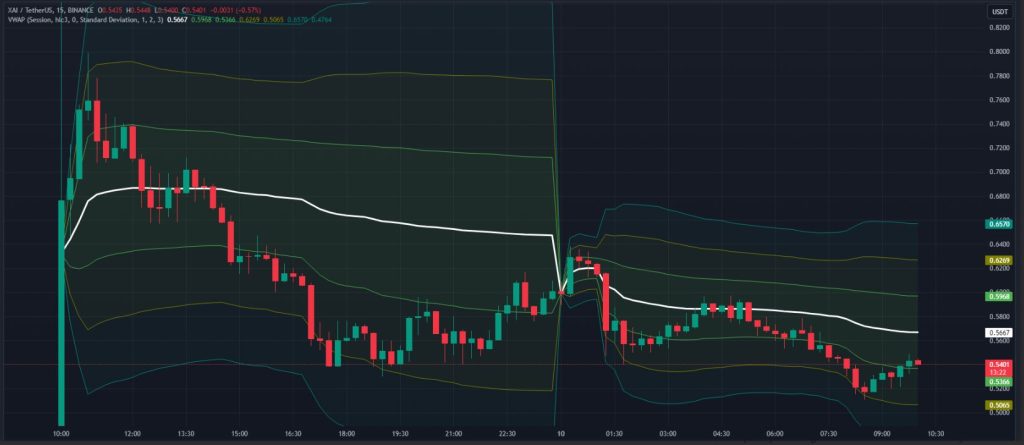
Source: TradingView
In the provided chart, the Volume Weighted Average (VWA) is depicted along with standard deviations of 1, 2, and 3. A greater distance from the VWA suggests a higher likelihood of prices reverting toward the VWA. Presently, XAI is on a trajectory toward the VWA from below. If additional buyers continue to enter the market, there is potential for the price of XAI to rise and surpass the VWA. Consequently, individuals looking to take a long position may need to exercise patience, waiting for a market movement before entering.
Xai (XAI) Price Analysis – Bollinger Bands (15 min Chart)
Bollinger Bands, devised by John Bollinger, are a form of price envelope that establishes a range with upper and lower limits within which prices are expected to fluctuate. This methodology relies on the principles of standard deviation and period.
In the displayed chart, the upper band is computed by adding two times the standard deviation to the Simple Moving Average, while the lower band is determined by subtracting two times the standard deviation from the Simple Moving Average. The widening of the bands indicates an anticipated increase in volatility, whereas their contraction suggests a reduction in volatility.
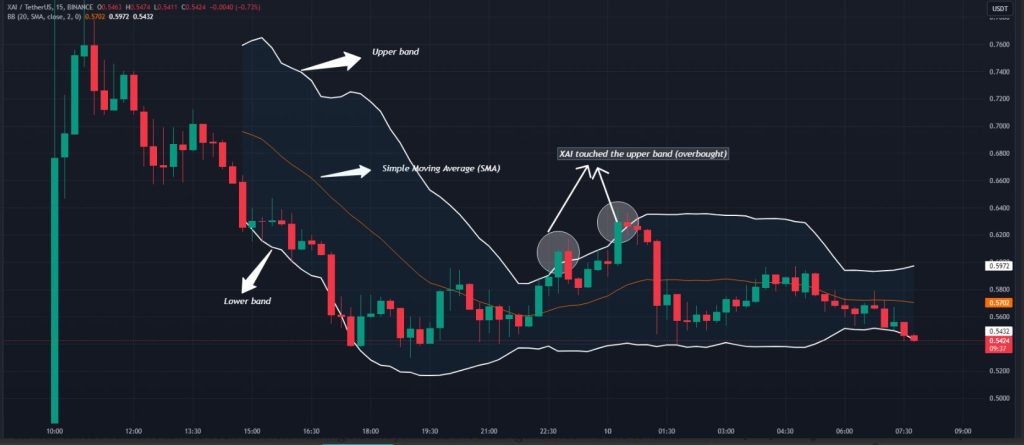
The provided chart illustrates a significant surge in XAI’s value upon its introduction, followed by a subsequent decline. Currently, the token appears to be trading within the confines of the Bollinger Bands, moving sideways. At present, the token is positioned on the lower band. This situation presents a notable opportunity for traders to capitalize on a potential buying opportunity, often referred to as “buying the dip.” By doing so, traders may contribute to increased demand, potentially driving up prices and allowing XAI to reach the upper band of the Bollinger Bands.
XAI (XAI) Price Prediction 2024
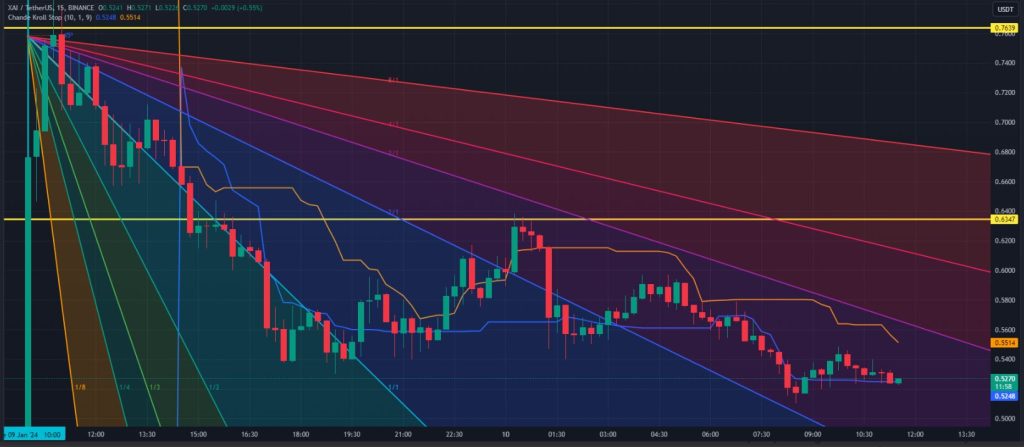
The chart above illustrates XAI’s movement along the 1:1 Gann line in a diagonal downward trajectory. Nevertheless, the descent in value became less steep as the token entered a consolidation phase and moved laterally. Given that this marks the inception of the coin, predicting XAI’s future direction proves challenging, especially amidst market volatility due to the pending BTC ETF approval and imminent BTC halving.
The Chande Kroll Stop indicator, a tool aiding in stop-loss determination, indicates a short-stop loss at $0.55 and a stable long-stop loss at $0.52. The decreasing short stop-loss suggests a potential shift, while the unchanging long stop-loss implies stability.
The observed scenario suggests that, despite the ability of bulls to establish new highs, bears have not managed to exert downward pressure on XAI. This resistance may be attributed to current market saturation. In the event of an XAI spike, a surge past $0.76 and even up to $1.5 is plausible. Conversely, a decline could see XAI finding support at the 2:1 Gann line, with a potential target of $0.5.
Related Articles:
Ripple Price Prediction 2024: Long XRP Before $1, Is It Worth The Risk?
Solana Price Prediction: Will SOL reach 300$ in 2024 – Technical Analysis
Solana Price Prediction: Is a Breakthrough Above $120 Imminent?
For more content like this do follow us on Instagram, Facebook and X
Disclaimer:
The information herein is purely for general informational purposes, not constituting financial, investment, or professional advice. Reliant on publicly available information and personal interpretations, its accuracy, completeness, or relevance isn’t assured. Readers are strongly urged to perform individual research before financial decisions, given the risks involved. Past performance doesn’t predict future results, and personalized advice from a qualified financial professional is recommended.
The author and platform disclaim responsibility for losses resulting from reliance on this content. Financial markets fluctuate, and investments can rise or fall. Opinions expressed are solely the author’s and may not reflect the platform’s views. Trading carries inherent risks; users should exercise caution, assess risk tolerance, and seek professional advice. This article doesn’t endorse specific actions regarding financial instruments.
Accessing and reading this article implies agreement with this disclaimer. The author and platform aren’t liable for direct or indirect consequences of using or relying on the provided financial information.