Bitcoin (BTC)
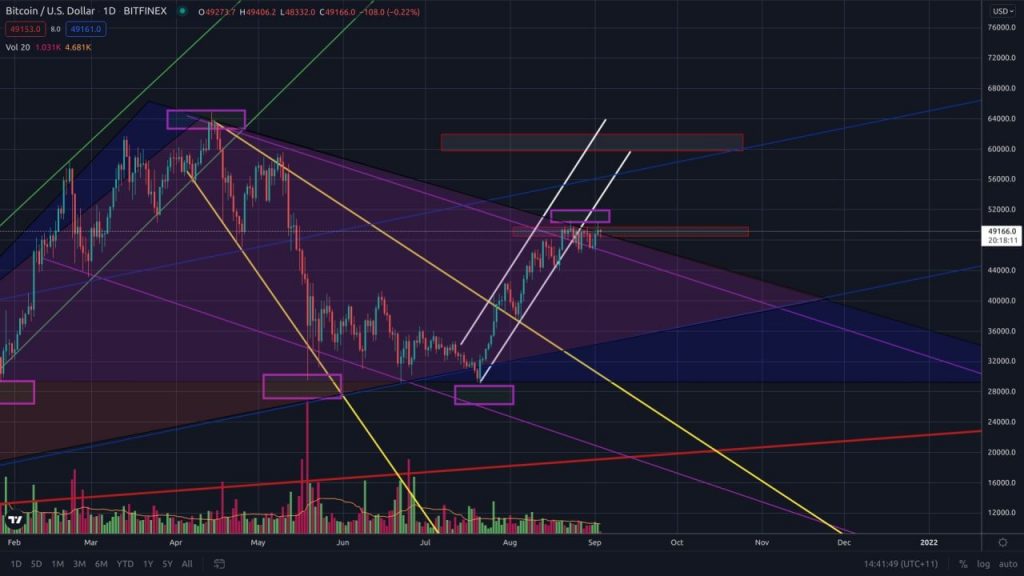

The premier cryptocurrency continues to storm the resistance level with mixed success. Many traders have already started celebrating the win, mistakenly suggesting that with Bitcoin surpassing $ 50,000, the dark days of uncertainty were over. However, it would have been necessary to await the confirmation of this victory, resulting in particular in the consolidation of the price of the asset above the levels of 51,000 – 52,000 dollars.
Unfortunately, this consolidation did not take place. The sellers then seized the opportunity and pushed the price of Bitcoin below $ 50,000, causing a series of sell-offs of the positions of some overconfident buyers.
The state of affairs is not that bad, however. This new bullish wave looks much more powerful than any that came before it. Contrary to what has happened the last few times, Bitcoin is not consolidating into a narrow trading channel, but is constantly trying to secure its authority over the new local high which corresponds to the $ 50,000 level.
This recent increase suggests that buyers are fed up with price stagnation and are determined to forge their way to new all-time highs. Their persistence has also impacted altcoins which have reacted to recent events by showing, for some, exceptional growth.
This increase cannot become problematic if the bulls exhaust their strength without achieving a significant result. Such a situation will spawn a new wave of sales that will lower the price of Bitcoin until it reaches its support level of $ 46,000. It will then be necessary to wait for a new accumulation to occur, after which the traders will have to start again from zero in their attempt to cross the resistance. In this case, it will also be necessary to consider the eliminations of long positions which have surely been opened by optimistic traders.
As a whole, the behavior of Bitcoin inspires confidence in the success of this adventure. During the last day, the price of the biggest cryptocurrency rose significantly before falling slightly and rising again. Even if this Friday started with a drop in the price of Bitcoin, the creation of Satoshi Nakamoto has already taken its positions and is currently trying to break through the resistance level. Fluctuations in the price give hope that the battle for this level will finally come to its logical conclusion by the end of the week.
By studying the weekly Bitcoin timeframe (1 candle = 1 day) in previous reviews, we have seen the formation of a triangle, based in particular on the presence of descending price peaks and stable price funds. Within this triangle, the chartist figure called the “bullish pennant” could be recognized. This figure is one more argument in favor of further growth in the price of the asset.
If the usual (bullish) figure exit scenario occurs, Bitcoin holders should expect another round of explosive growth that will take the world’s largest cryptocurrency to a new all-time high. This bull run could potentially mean consolidation above the $ 90,000 – $ 100,000 levels.
The $ 50,000 mark is not only a dynamic resistance level, but also a significant psychological level. It is likely that this is precisely why this number is so difficult to cross. The law of large numbers, as well as that of round numbers, applies perfectly to the cryptocurrency market. Traders prefer to sell their assets near levels that they see as aesthetic value. Or maybe they’re just too lazy to put an amount like $ 51,253 in their limit orders. Either way, when Bitcoin approaches key levels such as $ 50,000, $ 60,000, $ 70,000 and so on, significant volumes of the asset are sold.
Crossing the $ 50,000 mark becomes all the more important given that this number also represents the dynamic resistance level which indicates the downward nature of the Bitcoin trend. Consolidation above this level will mark the start of the new bull run and the asset’s shift from a descending global channel to an ascending global channel.
This same conclusion is confirmed by the formation of the “bullish flag” which reinforces the probability of the move described above. For our readers who do not yet know it, technical analysis and the theory of chartist figures are based on the dogma that all variations in the market are repeated. In a system where everything is decided by a majority of votes and where the number of votes of each is determined by the amount of funds available, individuals instinctively or intentionally follow the same algorithm. The chartist figure called the “double top” for example is actually a graphical representation of the fact that the asset has failed, twice, to cross the resistance level, even despite a correction and an accumulation of positions between both attempts. Therefore, Any trader who knows a little about the market will close his positions after seeing the formation of this pattern because he will be sure that the price will drop and he will be able to buy the asset back at a lower price. Most other traders will have the same idea, and the figure will come true, even despite the doubts of some. This is exactly the purpose of identifying chartist figures. They are in fact a visual representation of the decisions made by thousands of other traders. This is exactly the purpose of identifying chartist figures. They are in fact a visual representation of the decisions made by thousands of other traders. This is exactly the purpose of identifying chartist figures. They are in fact a visual representation of the decisions made by thousands of other traders.
In summary, Bitcoin continues its attempts to break through the resistance level that has already become iconic for the entire cryptocurrency market. On smaller timeframes rollbacks of up to $ 46,000 can occur, but the overall Bitcoin trend signals an impending rise above $ 50,000 and, as a result, the start of a new bullish wave until levels of 90,000 – 100,000 dollars.
Ethereum (ETH)
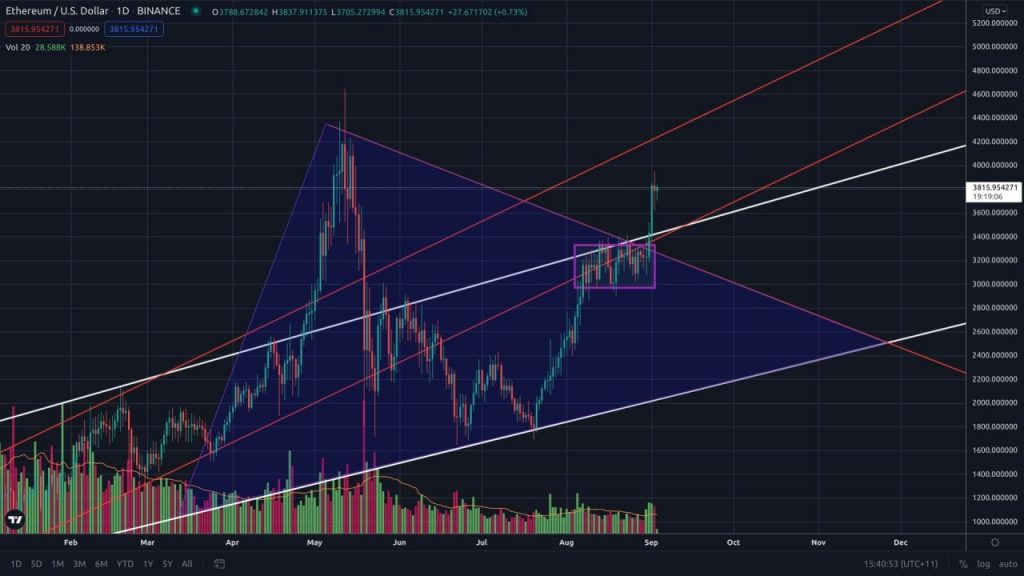

While haters talk about a near retirement from Ethereum and mention more modern rivals like Cardano and Solana, the world’s second largest cryptocurrency by capitalization pays no heed to these exclamations and continues to soar. local.
Last night, Ethereum almost broke through the $ 4,000 level, but decided to stop at $ 3,950.
At the time of writing this review, the price of the first altcoin is trading around $ 3,817 which is pretty impressive. At this rate, Ethereum could even hit $ 10,000, especially if Bitcoin finally breaks its resistance level and thus heralds the start of a new bull run.
It would be advisable to keep a certain amount of this asset in your wallet, even if you are not particularly interested in blockchain technology. There is no longer any doubt that the price of Ethereum will increase significantly in the near future. We can only congratulate those who invested in this token when its price varied between 80 and 100 dollars.
According to technical analysis, Ethereum is currently trading within an ascending channel and has the potential to grow at least to the $ 4,200 level. If by reaching this level Ethereum manages to exceed the resistance of the bears, we will have to expect new all-time highs.
Index of fear and greed


The Fear and Greed Index saw no mood swings in the market. Even Bitcoin’s recent rebound from its resistance level did not surprise traders. It is even likely that many of them were waiting for it so that they could seize the opportunity and reopen positions before the asset hit $ 50,000 again.
Top 10 altcoins
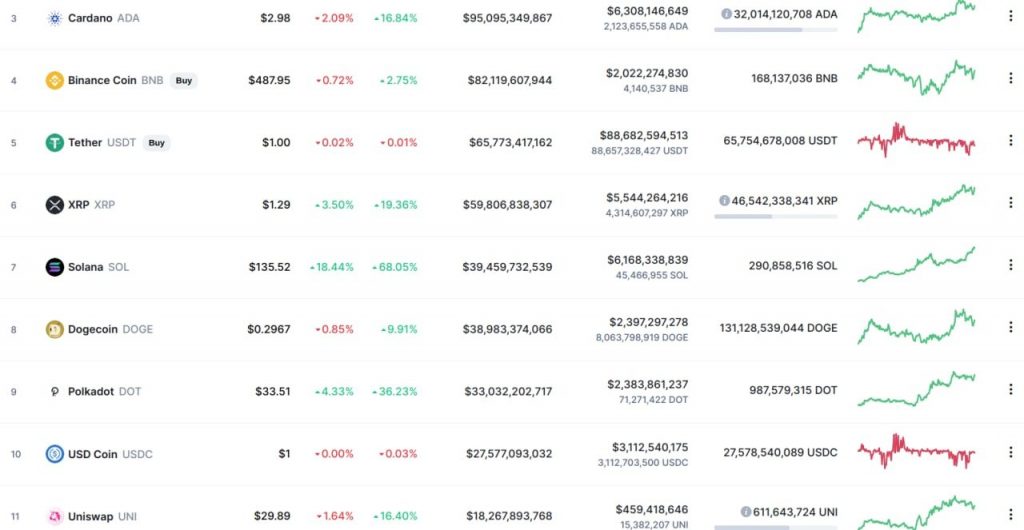

The ten most popular altcoins according to CoinMarketCap have reacted ambiguously to Bitcoin’s attempts to break through the iconic resistance level. This is probably related to the fact that each wave of Bitcoin’s correction also causes altcoin prices to drop, even though they were initially heading for confident growth.
Holders of Binance Coin (BNB) are not particularly happy with the dynamics of this token, even despite the Twitter community actively promoting the idea that the asset has enough potential to reach the token level of $ 1,000. . If this turns out to be true and Binance Coin follows the Ethereum journey, today may be one of the last opportunities to invest in this asset at a relatively affordable price.
Even despite the success of the test of the ability to use smart contracts via the Plutus framework, the price of Cardano remains immobile. New features on the coin’s mainnet are slated to launch on September 12, and many traders expect this asset to grow significantly. It would obviously be nice if Cardano followed Ethereum not just technologically, but also in terms of the price of the asset. It seems, however, that it will still take a long time.
Solana (SOL) proves once again that it is not a “dead” project. When part of the community decided that the asset had already exhausted its potential, Solana not only resumed its positions, but even surpassed the previous local peak.
IOTA (MIOTA)
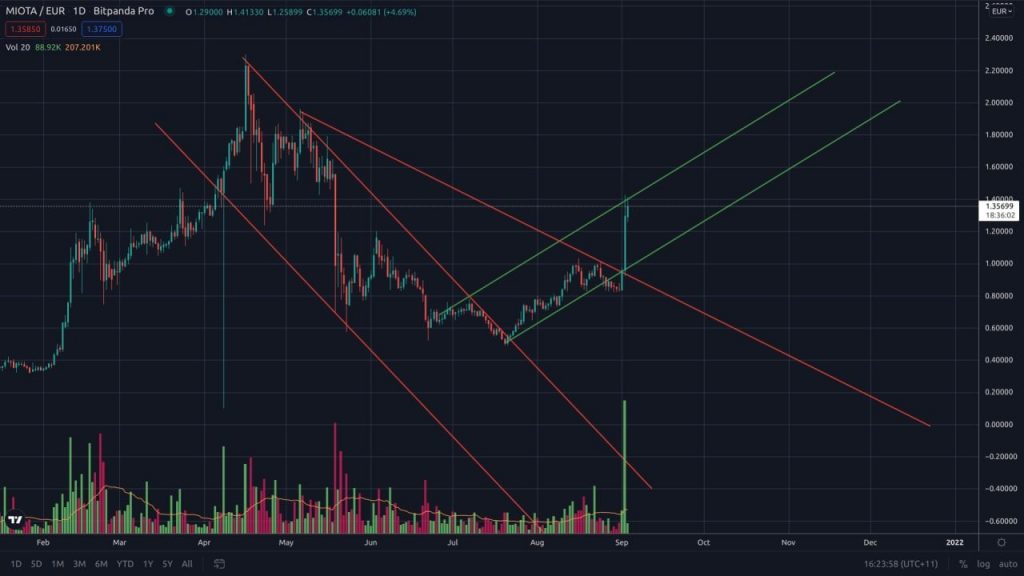

According to CoinMarketCap, the best performing asset this Friday among the 100 most traded cryptocurrencies is IOTA (MIOTA). This token brought its holders around 30% profit in a single day. At the weekly level, this parameter has already crossed the 67% bar.
Here is the chart of the report of IOTA to the Euro available on TradingView. As you can see from the screenshot, the price of the asset in question has risen significantly in just two days and is currently testing the resistance level within the ascending trading channel.
Taking into account the recent increased activity of Bitcoin, it would be unfair to say that this token no longer has the potential to go beyond the upper limit of its trading channel. It is likely that IOTA will hit a new all-time high very soon.
FTX Token (FTT)
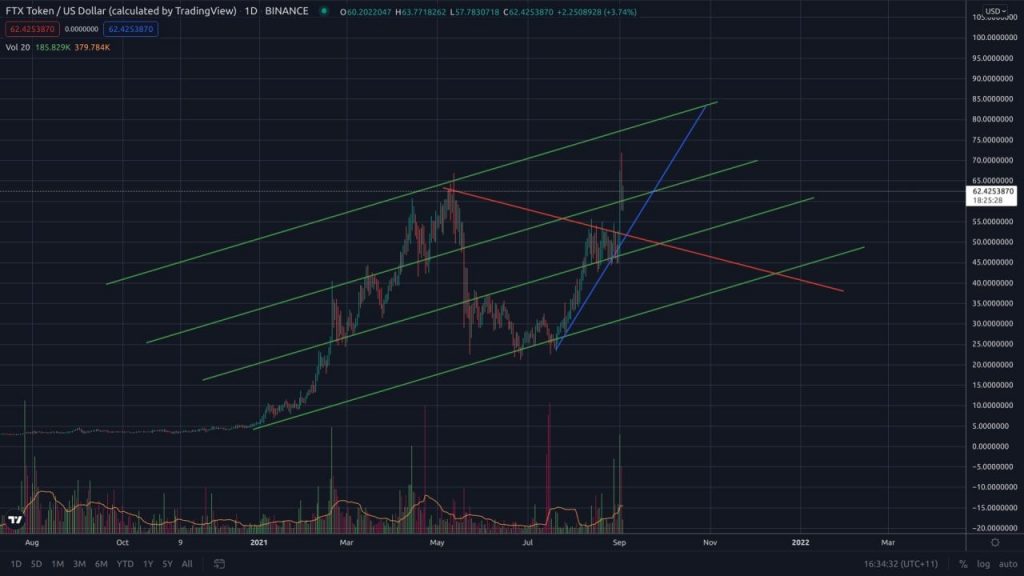

The loser of the day is FTX Token (FTT). At the time of this writing, this asset has already fallen in value by more than 9%.
Overall FTX Token is moving within an ascending channel and has moved closer to the resistance level setting a new all-time high. The potential for future growth is however not yet exhausted, which is reinforced by the fact that the token is moving along a resistant support level (represented on the chart by a blue line).
The cryptocurrency market is currently going through an important stage. If Bitcoin manages to break through the resistance level, then it will trigger a bull run on the entire market. However, we must remain cautious. Don’t neglect risk management and don’t forget about stop-losses.

