The daily chart shows that the MATIC price declined to a low of $1.0853. This was a notable level since it was the lowest level since early this month. As such, the price formed a double-bottom pattern whose top is at $1.4930. It also moved below the 25-day moving average while the Relative Strength Index (RSI) declined to a low of 40. (Also Read: Does Cosmos have a future?)
Therefore, while the situation seems bearish, the double-bottom pattern points to a significant bounce in the near term. This view will be invalidated if the price moves below today’s low at $1.0850.
Lets take a look at the different technical analysis setups for Polygon (Matic) and try to prediction the price and its movement
2EMA (Moving Average Exponential) Set up with length 50,100
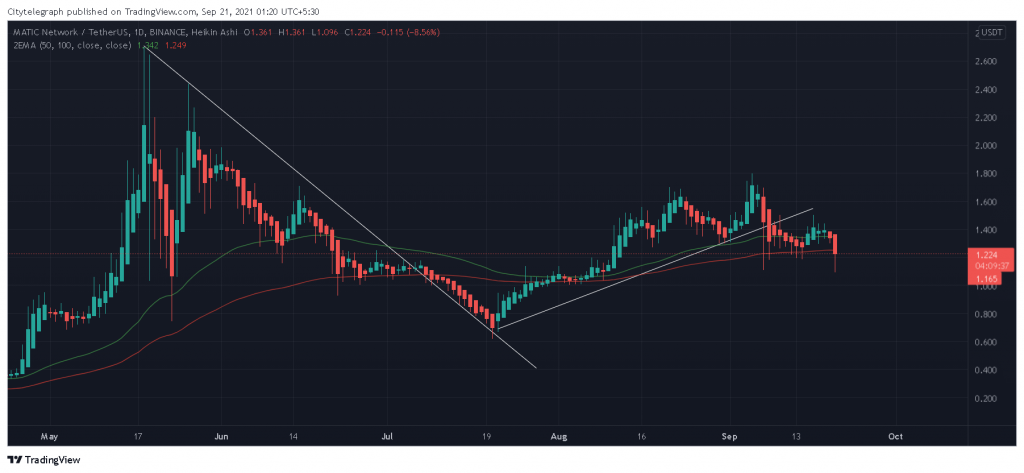
As you can see in the chart above, the 2EMA is still bullish but struggling to maintain its support level. On Sept 7th Matic has failed to maintain its support over the trend line and fallen towards $1.08 mark which is again a new support level for Polygon as of now.
Still, as the EMA 50 is above EMA 100 means shows a supports from the community and market.
Lets see what RSI says:-
RSI is actually losing its momentum, where as the price is going in a different direction meaning that this fall is just a small correction for Matic and there is lot of potential for Matic to jump back and let the bulls open in the field. This is not going to happen faster or sooner, but seeing massive adoption in Matic and huge development on the top of its blockchain it will happen for sure.
Due to the correction, the MACD does not looks favorable for Polygon in the charts above. Though the correction is temporary and within next few days the MACD will also start showing bullish signals. So if anyone is planning to make new long/short entries and play with leverage to gain quick profits, then this would be best time to keep a close watch with MACD to make good entry.
Another popular technical analysis indicator DMI is not indicating any movement in the price of Matic. As per the chart above, the White line in the DMI indicator is of ADX. ADX indicates if there is a movement in the the market or not. So if the value of ADX is below 30 (in a day chart – or 20 in 5min to 1 hr chart), meaning the price or the market will move side wise as of now. Since the value to the ADX as per the chart above is 17.02 meaning the Matic might move sidewise for a while with the price ranging b/w the new support and recent high.
Do you use Fibonacci Retracement tool? Well, according to another famous technical indicator i.e Fibonacci Retracement, you can see that the price already had a 50% retracement 2 times on 21st Aug and 4th Sept respectively. Currently the candle is entering the zed zone but it might hold the price there for a while due to support and low ADX too.
Since, retracement 50% is something likely to happen always while trading any asset. It will surely happen very soon in Matic too.
Technical Analysis: Polygon Price Prediction