The graphical pattern of the “Diamond” pattern is rare in financial markets. But with the correct identification of the model, the trader has the opportunity to make quick profits. A rather specific name comes from the structure of the pattern, because it resembles a unique cut of a diamond. This pattern can be formed on any timeframe, but the longer the timeframe, the stronger the signal.
In general, the “Diamond” pattern acts as a reversal figure, the formation process takes place either at the top of the trend or already at the bottom, but there are exceptions when the trend line is broken.
In fact, the formation of the “Diamond” graphical figure occurs during periods of passive price movement; it is graphically represented as two combined triangles: an expanding triangle and a standard symmetrical triangle. The boundaries of the diamond are the lines of the triangle.
Opening long positions:
It is not advisable to trade within the “Diamond” pattern, therefore it is best to trade on the breakout of the
boundaries of this pattern .
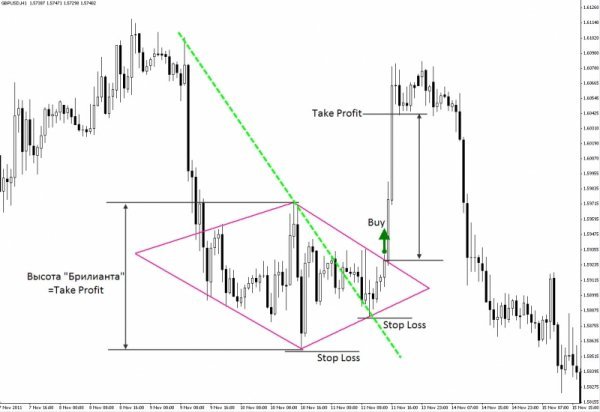
Let’s consider an example of the “Diamond” pattern using the example of the GBPUSD (H1) currency pair:

1. Choose one of the options and try to make a deal:
a) at the moment of the trend line breakout – it is best to open positions after the candle or bar closes above the trend line level.
b) above the maximum point of the formed “Diamond”.
c) above the last peak of the pattern.
d) on the rebound from the broken pattern line.
2. It is recommended to place a stop-loss order under the very minimum of the “Diamond”, and you can also
place it under the minimum of a graphical formation.
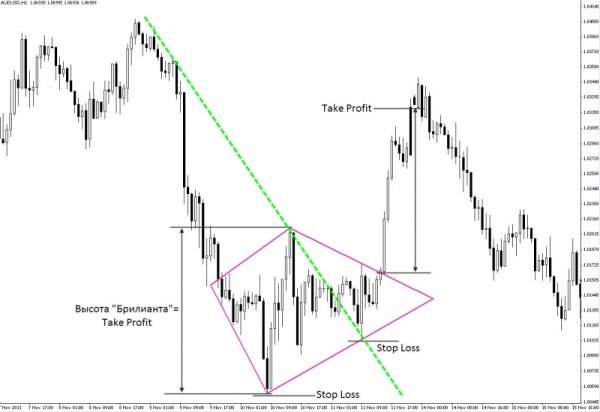
3. At the distance that corresponds to the height of the “Diamond” pattern itself, from the breakout point of the pattern, set the take – profit. We can partially close the deal at this level. We will move the remaining position to the breakeven level.
Another example on AUDUSD (H1):

It is necessary to apply the opposite conditions when opening a short position.

