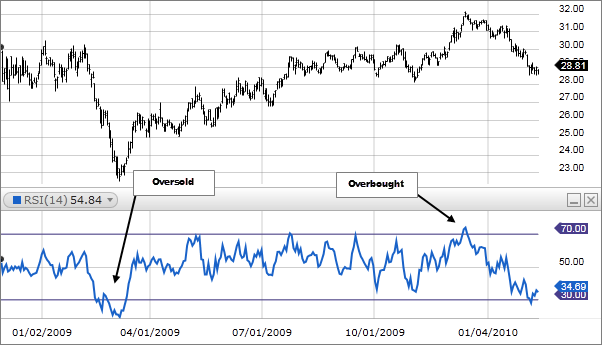
The Relative Strength Index (RSI) is a prominent momentum oscillator widely utilized in technical analysis for evaluating overbought and oversold conditions in the market. Developed by J. Welles Wilder, this indicator oscillates between 0 and 100, providing insights into the speed and rate of change of a security’s price movements over a specified period, commonly 14 days.
How the RSI Works
The RSI is calculated based on the average gains and losses over a given period. The formula is as follows:
RSI=100−(100/1+RS)
Where RS (Relative Strength) is calculated as the average of X days’ up closes divided by the average of X days’ down closes.
Interpretation of RSI Levels
- Overbought and Oversold Levels: RSI values above 70 suggest overbought conditions, indicating a potential reversal or corrective pullback. Conversely, RSI below 30 signifies oversold conditions, hinting at a possible upward reversal.
- Failure Swings: These are indications of potential market reversals, where the RSI touches the overbought or oversold threshold and then fails to surpass or fall below the previous level, creating a swing rejection.
- Divergence: RSI divergence occurs when the price and RSI behave differently, providing strong indications of an impending market correction.


Using RSI with Trends
- Modify RSI Levels to Fit Trends: Recognizing the primary trend is crucial for accurate RSI interpretation. In an uptrend, oversold readings may be higher than 30, while in a downtrend, overbought readings may be lower than 70.
- Buy and Sell Signals That Fit Trends: Aligning signals with the prevailing trend helps avoid false alarms that the RSI may generate in trending markets.
Example of RSI Divergences
- Bullish Divergence: Occurs when the RSI shows an oversold reading followed by a higher low while the price forms lower lows, signaling potential bullish momentum.
- Bearish Divergence: Happens when the RSI produces an overbought reading followed by a lower high, contrasting with higher highs in the price, indicating potential bearish momentum.
Example of Positive-Negative RSI Reversals
- Positive RSI Reversal: When the RSI reaches a low lower than its previous low, and the security’s price reaches a low higher than its previous low, it suggests a bullish reversal.
- Negative RSI Reversal: When the RSI hits a high higher than its previous high, and the security’s price reaches a lower high, it indicates a bearish reversal.
Example of RSI Swing Rejections
- Bullish Swing Rejection: Involves the RSI falling into oversold territory, crossing back above 30, forming another dip without entering oversold zone again, and reaching a new high.
- Bearish Swing Rejection: Involves the RSI rising into overbought territory, crossing back below 70, forming another high without entering overbought zone again, and breaking the most recent low.
Why RSI is Important
- Price Prediction: RSI helps traders predict a security’s price movement.
- Trend Validation: Validates trends and identifies potential reversals.
- Overbought-Oversold Signals: Provides signals for overbought and oversold conditions.
- Buy and Sell Signals: Offers short-term traders buy and sell indications.
- Supports Trading Strategies: Acts as a technical indicator supporting various trading strategies.
Using RSI Alongside Other Indicators
While RSI is a powerful tool, combining it with other indicators like moving averages and trendlines enhances its effectiveness. RSI’s signals are most reliable in oscillating markets, and considering additional indicators provides a more comprehensive technical analysis.
Limitations of RSI
- False Signals: True reversal signals are rare, and false alarms may occur.
- Long-term Momentum: RSI can stay overbought or oversold for extended periods during significant momentum.
- Trending Market Reliability: RSI is less reliable in trending markets compared to trading ranges.

