Uniswap (UNI) has experienced a notable bullish trend over the past few weeks and this uptrend is expected to continue.
Also Read: Chingari’s 900% Surge in User Base
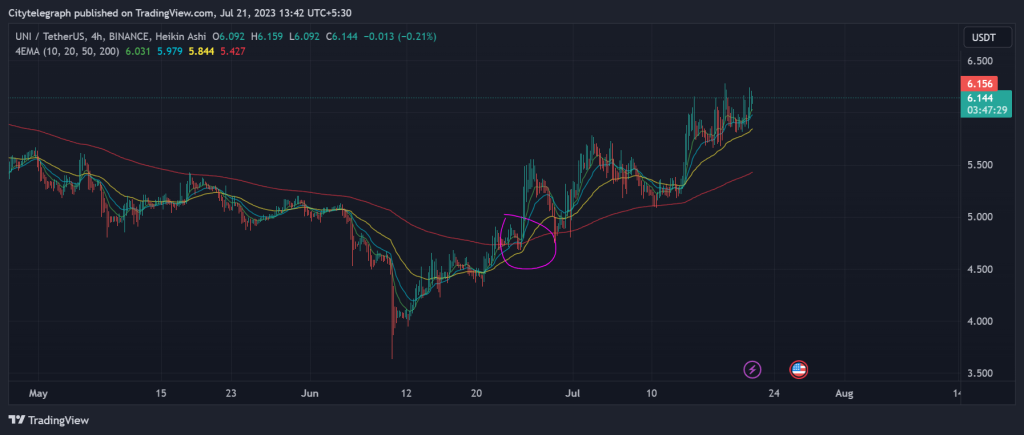
Following a sharp sell-off on June 10, the UNI price has shown resilience by surging 66 percent to its current value of $6.04. After regaining the red downward trend line at the beginning of the month, the price also broke above the 200-day exponential moving average (EMA200) (blue) in recent trading days. This breakout has improved the chart outlook for Uniswap, the native token of the world’s largest decentralized cryptocurrency exchange. One contributing factor to this positive momentum is the development of Uniswap version 4, and the increased trading volume on the leading decentralized exchange (DEX) is also proving to be beneficial. Despite potential headwinds from the new crypto law in the USA, which could impact decentralized finance projects, Uniswap’s price has not been adversely affected by the political concerns.
Must Read: Demand for XRP futures rises to record high
As predicted in the previous analysis from June 13th, the sell-off appears to have halted for now. As long as Uniswap maintains its price above the EMA200 and horizontal support in the orange zone, there is a likelihood of further price appreciation towards the $6.61 target. As of now, as long as Uniswap does not dip below the Supertrend and the red downtrendline support at $5.03, the buyers are expected to remain in control.
Bullish price targets for Uniswap Price Prediction are projected at $6.48-$6.67, $7.38-$7.65, $8.20, $8.99-$9.28, $9.82, $11.00, and $12.20-$13.01.
Over the last 24 hours, UNI has risen by 3.4 percent, contributing to a weekly gain of 13.8 percent. Sustained stability above the orange support zone would likely drive the price towards the $6.48-$6.67 yellow resistance area. The Golden Pocket area will play a decisive role in determining the short-term direction. Historically, this zone has acted as a strong resistance in March and April. If Uniswap manages to reclaim this chart area with a daily closing price, the buyers may then target the yearly high between $7.38 and $7.65.
A considerable amount of profit-taking can be expected at this strong resistance level. If, in the medium term, Uniswap successfully surpasses this barrier and moves above the intermediate station at $8.19, it may continue its upward trajectory towards the 2022 summer highs, ranging from $8.99 to $9.28. Surpassing the high of July 28, 2022, at $9.82 would pave the way for a potential rally towards $11.00.
Beyond this point, the price could aim for the trailing edge between $12.20 and $13.01, where the 127 Fibonacci Extension also aligns. Given the significance of this chart area, it represents the maximum price target for the upcoming months.
Bearish Uniswap price targets for the coming trading weeks
Bearish price targets: $5.82/5.63 , $5.20/5.03, $4.80, $4.47, $4.04, $3.63, $3.35, $ 2.95
The bears finally had to let the buyers do their thing. Only a relapse below the EMA200 could initiate a new course consolidation. Then there should be a directional decision in the area of the turquoise zone. The super trend paired with the always relevant chart technical area between 5.20 US dollars and 5.03 US dollars represents an important support. The buyer side should already counter this more clearly in order to avert a fall below the downward trend line.
However, if this area is permanently undercut, the chart picture will cloud over again in favor of the seller camp. If Uniswap then breaks the horizontal support at $4.80, further downside potential towards $4.47 will be activated. If this support level also fails, a retest of the horizontal support at $4.04 should be planned. This mark was defended several times on a daily basis in June.
If, contrary to expectations, the UNI price does not stabilize here, a retest of the previous month’s low of USD 3.64 is likely. The buy side needs to be there and defend this level on an end of day basis to form a double bottom. However, if this important support level is abandoned, the focus will be on the previous year’s low of $3.35 as the maximum price target on the downside.
Looking at the indicators
The RSI as well as the MACD indicator show stable buy signals in the daily chart, but appear overbought in the short term. In addition, the 4-hour chart shows bearish divergences for both indicators. Therefore, a consistency test of the orange support area must be scheduled at any time.
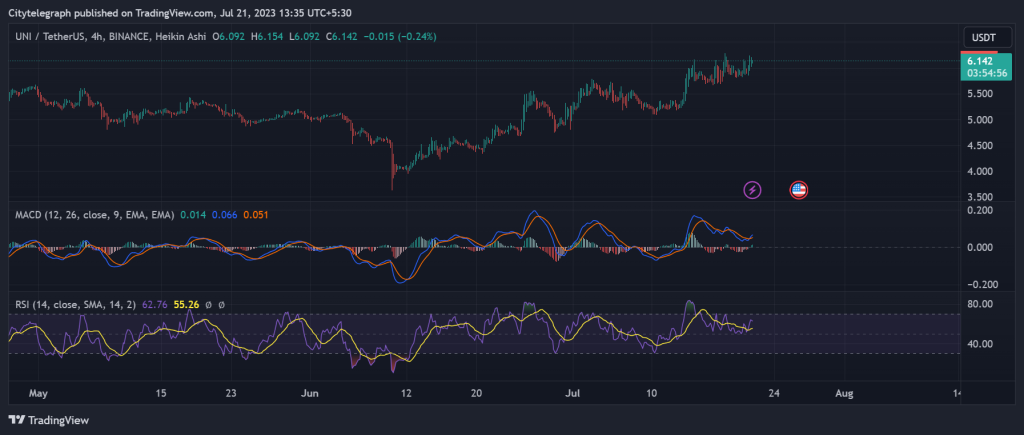
On a weekly basis, the RSI is about to form a fresh buy-signal at 54. A jump from the neutral zone to the north would develop further price potential from a general perspective. The MACD has also activated a slight long signal, but is trading well below its 0 line.