Hey there, fellow crypto enthusiasts! Let’s dive into the exciting world of BNB and explore the possibilities that lie ahead. Last week, BNB took a little dip, dancing around $309.22 after a brief stint at $316.26, but the last 24 hours brought a pleasant surprise with a 1.14% surge. The crypto realm is abuzz with a hint of bullish vibes, making it quite the ride for BNB fans.
Now, the real kicker – our technical analysis paints a pretty bullish picture, hinting at a potential $390.34 for BNB by 2025. Quite the prospect for investors, especially considering the recent jigs and reels in the market.
In the here and now, BNB’s circulating supply is a solid $153,856,150, flaunting a hefty market cap of $47,677,020,323. These figures shout out the importance of BNB in the crypto universe, setting the stage for our deep dive into its future.
Fasten your seatbelts because 2023 was a wild ride for BNB, full of ups and downs. The year kicked off with high hopes, riding a bullish wave in January that pushed BNB to a peak of $346.8 by mid-March. Now, stepping into 2024, the big question is whether BNB will break through the $348.32 barrier – a topic we’re about to unravel in the upcoming sections.
Come along as we break down technical indicators, ride the waves of market trends, and explore potential catalysts that might just send BNB soaring to new heights. Get ready for insightful analyses and expert perspectives on the thrilling BNB journey in 2024. Stick around – it’s going to be one heck of a crypto adventure!
Moving Average of BNB – Binance Coin Price Forecast Jan 2024 (Charting at 4H)

The above chart shows the usage of Simple Moving Averages (SMA) with lengths of 50 and 200. The green line in the chart represents SMA 50, while SMA 200 is shown in red. Based on the technical analysis of Binance coin, we can observe that SMA 200 is currently below SMA 50. This indicates that the price of BNB will likely increase in the near future, as the length of SMA 200 is significantly lower than the length of SMA 50. Therefore, according to this indicator, the moving average price is expected to rise in the short term.
Relative Strength Index (RSI) of Binance – BNB Price Prediction Jan 2024 (Charting at 4H)

Based on the RSI analysis of Binance Coin (BNB), it can be observed that the RSI (Violet Length) is currently below 30 and not exceeding 70. This indicates that BNB is neither overbought nor oversold, implying that the price of BNB may experience a bullish trend in the near future. Additionally, the Simple Moving Average (SMA) suggests that the price of Binance Coin is likely to increase, making it a potentially good investment opportunity.
MACD of BNB – Binance Price Forecast Jan 2024 (Charting at 4H)
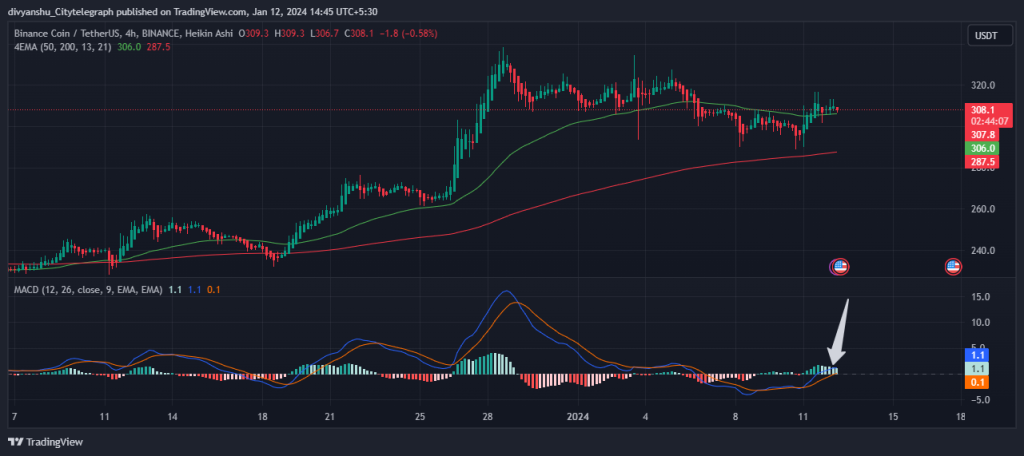
According to the MACD chart analysis of BNB Coin, a bullish trend may be on the horizon as the blue line has crossed over the orange line, indicating a potential increase in its price. Additionally, three technical studies have been implemented in the BNB price prediction analysis, all of which suggest a forthcoming price explosion in BNB coins, as per the indicators used in the analysis.