, wicks (high/low). Patterns indicate trends or reversals.)
Intraday trading, a method where traders buy and sell stocks within the same day, demands a keen understanding of market dynamics and the ability to make timely decisions. Candlestick charts are invaluable tools for intraday traders, providing insights into price fluctuations and aiding in decision-making. In this comprehensive guide, we’ll explore the intricacies of reading candlestick charts for intraday trading, covering their composition, analysis, and essential chart patterns.
Understanding Candlestick Charts: The Basics
Composition of a Candlestick Chart
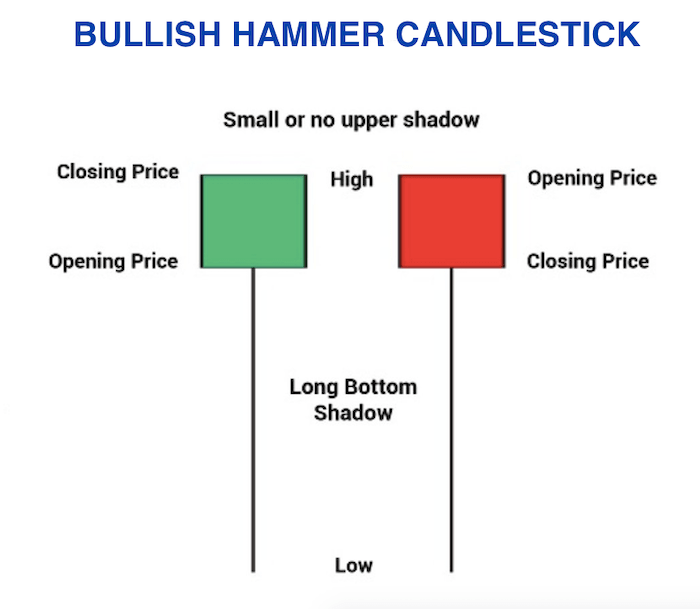
Candlestick charts represent price movements in a visually intuitive manner. Each candle consists of three parts:
- The Body: The colored (Red or Green) area representing the opening and closing prices.
- Upper Shadow: The vertical line above the body indicating the highest traded price.
- Lower Shadow: The vertical line below the body indicating the lowest traded price.
The color of the body signifies the direction of price movement – green for a rising market and red for a falling market. Four key data points define a candle:
- Open: The first trade during the specified period.
- High: The highest traded price.
- Low: The lowest traded price.
- Close: The last trade during the specified period.
Analyzing Candlestick Charts
Understanding the components of a candle is crucial for effective analysis. The body’s length and color reveal the opening and closing prices, while shadows represent highs and lows. For instance, consecutive red candles in a monthly chart suggest a falling stock price.
The wicks or shadows provide additional insights:
- A short upper wick on a red candle indicates the stock opened near the day’s high.
- A short upper wick on a green candle suggests the stock closed near the day’s high.
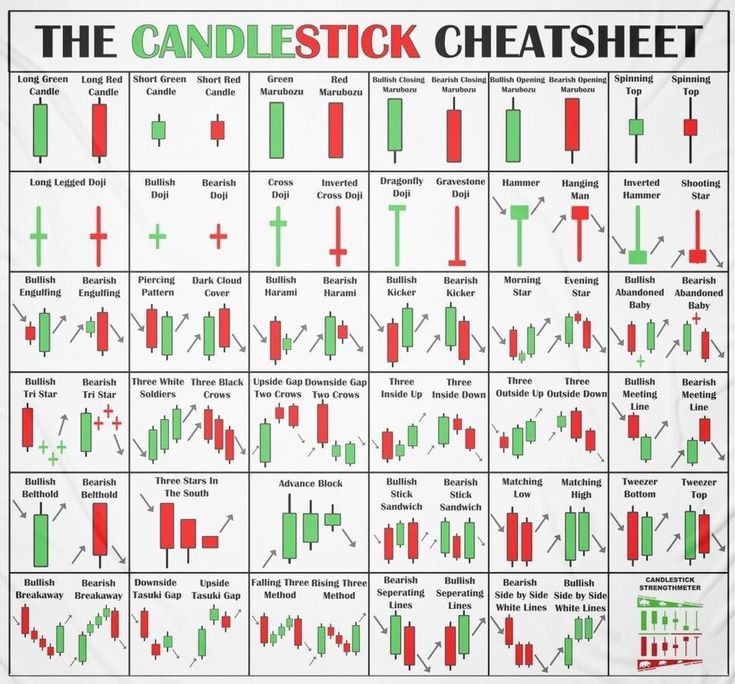
Candlestick Chart Patterns
Bullish Patterns
- Hammer Pattern: A short body with a long lower wick at the bottom of a downward trend, signaling a potential upward surge.
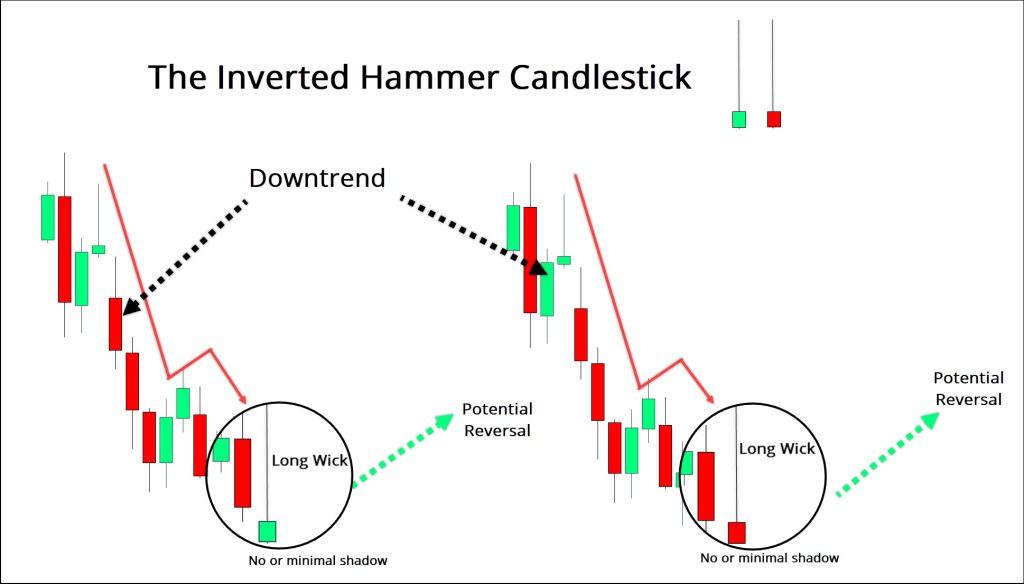
- Inverse Hammer Pattern: Short body, long upper wick, indicating buying pressure overcoming selling pressure at the downtrend’s bottom.
- Bullish Engulfing Pattern: Two-candle pattern with a small red candle engulfed by a larger green candle, signifying a bullish market.
- Piercing Line Pattern: Two-candle pattern with a long red candle followed by a long green candle, suggesting strong buying pressure.
- Morning Star Pattern: Three-candle pattern with a short-bodied candle between a long red and a long green candle, indicating reduced selling pressure.
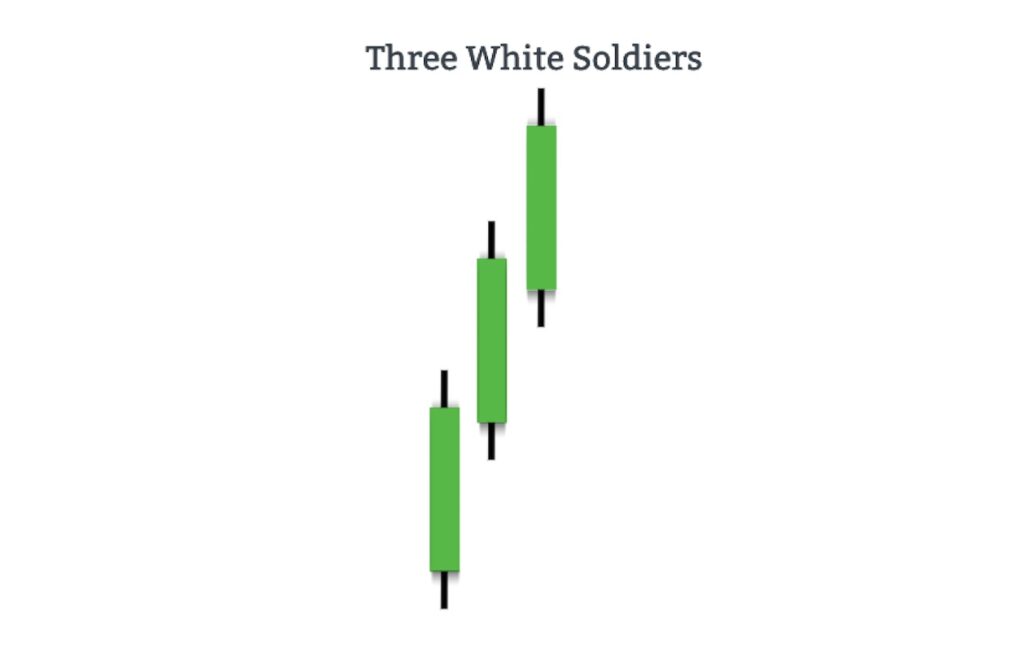
- Three White Soldiers Pattern: Three consecutive green candles after a downtrend, indicating a strong upcoming bull trend.
Bearish Patterns
- Hanging Man Pattern: Short body, long lower wick at the peak of an upward trend, signaling potential market control shift to bears.
- Shooting Star Pattern: Short body, long upper wick at the top of an upward trend, indicating selling pressure taking over.
- Bearish Engulfing Pattern: Two-candle pattern with a small green candle engulfed by a larger red candle, suggesting a market slowdown.
- Evening Star Pattern: Three-candle pattern indicating a reversal, with a short-bodied candle between a long green and a long red candle.
- Three Black Crows Pattern: Three consecutive red candles after an upward trend, indicating an upcoming bear market.
How to Read Candlestick Charts for Day Trading
Day trading, or intraday trading, requires a nuanced understanding of market trends and effective decision-making. Traders need to go beyond individual candles and delve into candlestick chart patterns. The chart patterns mentioned serve as essential indicators for analyzing trends, sentiment, and potential reversals in the market.
Conclusion
Candlestick charts are indispensable tools for intraday traders, providing a visual representation of market movements and invaluable insights. By mastering the art of reading these charts and understanding the nuances of various candlestick patterns, traders can enhance their decision-making abilities and navigate the dynamic landscape of intraday trading with confidence.
In conclusion, whether you are a beginner or an experienced trader, a solid foundation in reading candlestick charts is essential. This guide serves as a starting point, offering valuable insights into the world of intraday trading and equipping traders with the knowledge needed for informed decision-making.