9.4 C
New York
Tuesday, November 25, 2025
Home Blog Page 290

American stock indices rose by 0.5-1.5%

0

The US stock market finished trading on Friday on the rise after the release of data from the US Department of Labor on the unemployment rate in the country in May.

At the same time, the S&P 500 is only 0.2% behind the record high recorded last month, CNBC notes.

At the end of last week, the Dow Jones and S&P 500 indicators added 0.7% and 0.6%, respectively.ย The Nasdaq is up nearly 0.5%.

The number of jobs in the US economy in May increased by 599 thousand, according to data from the Department of Labor.

Unemployment in the country fell to 5.8% last month from 6.1% in April.

Experts on average expected an increase in the number of jobs in May by 650 thousand with a decrease in unemployment to 5.9%.

“While job growth was modest compared to expectations, the good news is that the numbers improved from the disappointing data from the previous month,” said Charlie Ripley, vice president of portfolio management at Allianz Investment Management.

Weak melons on the US labor market for April forced economists to revise their forecasts, writes MarketWatch.

Aneta Markovska, chief economist at Jefferies Financial Group, predicted 2.1 million job growth in April, much more than official data showed.

This time Jefferies’ maximum forecast was 450 thousand new jobs.

The Dow Jones Industrial Average rose 179.35 points (0.52%) to 34756.39 points.

Standard & Poor’s 500 climbed 37.04 points (0.88%) to 4229.89 points.

The Nasdaq Composite added 199.98 points (1.47%) to 13814.49 points.

Facebook Inc. quotesย rose 1.3%, although EU and UK antitrust regulators have launched formal investigations against Facebook Inc., believing that the company may have violated the rules of competition in the private classifieds Marketplace.

Broadcom Inc.ย increased by 2.2%.

One of the world’s largest semiconductor manufacturers in the second quarter of fiscal 2021 more than doubled its net profit and 15% revenue thanks to the strong performance of its semiconductor business.

Also Read:

AMC Entertainment Holdings Inc.ย fell 6.7% on Friday after falling 17.9% the day before.

The chain of cinemas has asked investors for the right to issue an additional 25 million shares, promising not to carry it out this year.ย On Thursday, the company announced the issuance of 11.55 million new shares.

The US dollar strengthens against the euro and is stable against the yen

0

The US dollar strengthens against the euro in trading on Monday, is stable against the yen.

Traders assess the statements of the US Treasury Secretary Janet Yellen and await the May data on the dynamics of consumer prices in the country, which the Labor Department will publish on Thursday.

Yellen said in an interview with Bloomberg on Sunday that US President Joe Biden, in her opinion, should seek the implementation of his proposed programs to support the economy totaling $ 4 trillion, even if this would increase inflationary pressures and raise interest rates in the country.

“If interest rates rise slightly, it will be a plus both from the point of view of society and from the point of view of the Federal Reserve System (FRS),” Yellen said.

American experts differ in their forecasts regarding the future dynamics of inflation in the United States.ย A number of economists, including Yellen, believe that the rise in inflationary pressures is caused by the effects of the pandemic and is temporary.

Others fear that the massive stimulus proposed by Biden will create sustained inflationary pressures over the long term.

According to Yellen, Biden’s programs will require an increase in government spending by about $ 400 billion a year, and this is not enough to trigger a long-term rise in inflation.

The consumer price spike that could result from the stimulus program will come to naught next year, she said.

The consensus forecast of experts surveyed by Trading Economics envisages acceleration of inflation in the US in May to 4.7%.

In April, consumer prices rose 4.2%, at the fastest rate in 12 years.

As of 9:36 Moscow time, the euro rate against the US dollar fell by 0.07% – to $ 1.2158 compared to $ 1.2167 at the close of the previous session.ย The dollar / yen pair is trading at 109.49 yen against 109.52 yen the day before.

The euro in the yen fell by 0.08% – to 133.11 yen against 133.21 yen at the close on Friday.

The index calculated by ICE, which tracks the dynamics of the dollar against six currencies (euro, Swiss franc, yen, Canadian dollar, pound sterling and Swedish krona), adds 0.1% during trading, the broader WSJ Dollar Index is stable.

El Salvador wants to legalize Bitcoin as the national currency

0

Bitcoin continues its sideways trend. Meanwhile, El Salvador wants to make BTC the national currency alongside the US dollar.

The ups and downs of Bitcoin continue at the beginning of the week. The cryptocurrency is again trading in the range of 36,000 US dollars today. At the time of going to press , the price of the digital store was trading at $ 36,206, up 1.12 percent.
However, the current sideways trend does not prevent some personalities in the crypto space from continuing to formulate bullish price targets for Bitcoin. For example, trading veteran Peter Brandt continues to believe in a long-term BTC rate of $ 100,000. The Winklevoss twins , who renewed their price forecasts of USD 500,000 per Bitcoin at the Bitcoin Miami Conference 2021, are much more optimistic .

Much more important for the crypto space, however, should be news from El Salvador. The Central American country rarely makes international headlines. But this time it’s different. At the Bitcoin conference in Miami, President Nayib Bukele expressed efforts that he was planning to make BTC a legal tender in El Salvador apart from the US dollar. On Twitter , he then delivered several effects that this introduction had with it.

“El Salvador’s GDP could increase by 25 percent”
First of all, legalization would have an effect on the country’s gross domestic product. Right now that’s around $ 27 billion. Bitcoin’s market capitalization is currently around $ 680 billion. If only 1 percent of this were invested in El Salvador, this could increase GDP by 25 percent in one fell swoop, says President Bukele.

In addition, the introduction also flushes new users onto the Bitcoin blockchain. Currently, around 70 percent of the population in El Salvador did not have any bank accounts. The proportion of undeclared work in the country on the Pacific coast is correspondingly high. President Bukele said:

In addition to being a moral imperative, financial inclusion is a way to grow the country’s economy by providing access to credit, savings, investment, and secure transactions.

President Nayib Bukele on Twitter

He also wants to create a space for innovation to change the future of finance and thus potentially help billions of people.

Nayib Bukele is controversial

With Bitcoin enabled as a means of payment, El Salvador would undoubtedly have a place in the history books. And the reactions on Twitter to the announcement are mostly positive. On closer inspection, however, there are other motives for the Salvadoran President. Because apart from Bitcoin, the US dollar is currently the national currency. El Salvador is currently facing impending sanctions from the USA.

In addition, President Bukele’s leadership style is considered authoritarian. This was expressed, for example, when he promoted political opponents from judicial offices. In addition, his party passed a law just a few days ago that expanded the president’s control over the central bank and took away the power of the private sector to campaign for the election of board members. In February 2020, an incident in El Salvador and internationally caused horror when Bukele let the national guard appear in parliament to put opposition members under pressure in a legislative vote.

Nevertheless, the drive to introduce Bitcoin as a means of payment appears to be of a serious nature. Even if it were only a small step in global economic terms, it would still have an enormous signal effect and could get the global Bitcoin adoption rolling.

The EU revised the rules for the import of the cash

0

The rules have been changed as part of the fight against money laundering.

The new rules for the import of cash begin to work in the countries of the European Union on June 3, 2021.

In the European Union, the definition of “cash” was expanded at the expense of an equivalent in other currencies, bonds, stocks or checks, according to the website of the European Commission.

As part of the EU’s efforts to combat money laundering and terrorist financing, all tourists entering or leaving the EU will be required to complete a cash declaration of โ‚ฌ 10,000 or more.

EU customs officials have the right to inspect people, their luggage and vehicles, as well as seize undeclared cash.

From June 3, the rules apply to the equivalent of 10 thousand euros:

– banknotes and coins (including currencies that are no longer in circulation but can still be exchanged at a financial institution or central bank);

– bearer instruments such as checks, travelers checks, bills of exchange and money orders;

– gold coins with a gold content of at least 90%;

– gold bars, nuggets or lumps with a gold content of at least 99.5%.

Customs officers may require entering citizens to submit a declaration of sending 10 thousand euros or more in cash by mail or courier.

The new rules allow customs officers to act in accordance with the instructions and for amounts less than 10 thousand euros, if, from their point of view, there are signs that the cash is related to criminal activity.

The cash declaration provides detailed information on the origin and future use of cash.

Earlier it was reported that tourists from Ukraine to enter Turkey from June 4 must have either a negative PCR test for COVID-19, or a rapid test for the determination of the SARS-CoV-2 antigen, or a document on full vaccination against coronavirus, or a document, certifying that the person has had COVID-19.

It was also reported that the UK has announced plans to introduce a point-based migration system as part of a sweeping overhaul of the country’s immigration system.

Why is the mutual fund market growing rapidly?

0

According to the Kazakhstan Stock Exchange (KASE), at the beginning of the second quarter of 2021, there were 13 mutual funds under the management of six management companies and 4 ETFs in the Securities of Investment Funds sector. The volume of trades for the three months of this year amounted to 17.3 billion tenge, having increased by 28 times compared to the first quarter of last year .

According to the deputy chairman of the board of KASE Natalia Khoroshevskaya, mutual funds, including exchange-traded investment funds, are actively gaining popularity against the background of volatility of stock markets, as well as due to the expansion of the list of offered instruments.

If at the beginning of 2020 only 7 securities of investment funds were offered on the KASE floor, then as of June 1, 2021 their list has expanded to 17 items. This happened due to the inclusion of mutual funds managed by JSC “Halyk Finance”, JSC “BCC Invest”, JSC “First Heartland Jysan Invest”, LLC “East-West”, as well as two ETFs on global shares of gold mining companies and companies from the clean energy sector , explained Natalya Khoroshevskaya.

โ€œAs the list of securities of investment funds expanded, the trading volume increased from 616.1 million tenge as of April 1, 2020 to 21.7 billion tenge by the end of five months of 2021, including 19.5 billion tenge accounted for trading in securities new mutual funds “, – she stressed.

KASE Deputy Chairperson noted that due to large trading volumes, the commissions of mutual funds are often lower than the market ones, which makes them popular among investors. โ€œIn addition, the increase in value from the sale of mutual investments is not taxed if the fund’s securities are traded on an organized market, and on an unorganized market they are subject to IIT at a rate of 10%,โ€ added Natalya Khoroshevskaya.

At the same time, starting from 2021, shares and shares of risk investment funds have been admitted to circulation on KASE. โ€œThis will be one of the first steps that will provide an opportunity for retail investors to participate in start-up projects, pre-IPO stories, interesting progressive projects and real sector tools,โ€ said Natalya Khoroshevskaya. All this, of course, increases the attractiveness of the stock market, she is sure.

It is obvious that the risk financing fund must meet certain criteria of the regulator, including the number of holders of the investment fund’s securities and the presence of a market maker.

โ€œHowever, one should not forget that the securities of such funds are intended only for qualified investors,โ€ the deputy chairman of the board of KASE noted. At the same time, the brokerage organization independently exercises control so that these instruments are purchased only at the expense of qualified investors, she explained. Individuals interact on the exchange floor only through brokerage / management companies.

According to the chairman of the board of the SkyBridge Invest management company Sholpan Ainabayeva, now the group of private investors who have neither experience nor significant savings comes to the stock market. And mutual fund for such unqualified investors is the most convenient format.

A mutual fund is an opportunity to get a diversified portfolio for little money, she said. For example, for 30-50 thousand tenge, such an investor will be able to buy only one or two shares of Kazakh telecom or several shares of Kaz TransOil. By purchasing a share in a mutual fund, he has the opportunity to own part of a portfolio of several securities from different issuers, explains Sholpan Ainabaeva.

โ€œUntil the end of the year, I think the growth of the segment of mutual funds trading on the stock exchange will continue. This is facilitated by low deposit rates, the expansion of the information field about the possibilities of the securities market, the arrival of commercial banks in brokerage activities and the availability of convenient mechanisms on the stock exchange, โ€she said.

In addition, as part of the latest initiatives of the regulator in the segment of mutual funds, management companies are allowed to buy shares on the stock exchange and be their market makers.

For any instrument traded on the exchange, it is very important to have a market maker. After all, an investor, choosing and investing in one or another unit investment fund, must think in advance about the mechanism for exiting the investment, explains Sholpan Ainabaeva. โ€œIt is very difficult for a management company to find market makers from among other management companies, it is absolutely logical that the management company itself should act as such a market maker,โ€ she says. According to her, lifting the ban and allowing management companies to be a market maker for mutual funds actually increases the liquidity and turnover of exchange trading in shares.

โ€œConsidering that now management companies are allowed to act as market makers of their own mutual funds, we predict that positive dynamics will continue in the exchange segment this year,โ€ says another expert, Chairman of the Board of Halyk Finance Farhad Okhonov. In turn, he notes that since the beginning of this year, the total assets of interval mutual funds managed by Halyk Finance have doubled, in proportion to the increase in the number of unit holders.

Farhad Okhonov also recalled legislative innovations that came into force in October last year, which significantly simplified the process of opening brokerage accounts. โ€œNow documents for opening a brokerage account can be confirmed using an SMS-code, and not only signed by hand or by means of an EDS. In addition, the professional participants of the securities market were given the opportunity to remotely biometric identification of potential customers using the services of the state database of individuals, โ€he said. Thus, when opening a brokerage account, the client does not need to provide an identity document, and in addition, the use of these services minimizes the risk of fraudulent activities for the broker.

In general, we can conclude that as awareness grows, the population is increasingly considering mutual funds as a convenient alternative or addition to private investment. Also, the active transition of management companies to the online format through the introduction of their own mobile applications encourages an increasing number of new investors to perform operations in the stock market.

BTC price update: bitcoin price remains sideways in the middle of the “battle” between bears and bulls

0

For the third week in a row, the price of bitcoin is below $ 40,000, after falling as much as 50% in about two weeks (from $ 59,000 to $ 30,000 at its lowest point).

Unlike last week, during the last few days bitcoin has not even momentarily touched the level of USD 40,000 and remains lateral, in a range between 35,000 and 39,000.

According to this week’s Market Report from Glassnode, the current state of the bitcoin market is best describedย asย a “battlefield”ย between bulls and bears.

Specifically, long-term BTC holders are not selling at current prices, pointing to a new bullish move, while recent investors are selling their bitcoins at a loss, anticipating a prolonged downtrend, the researchers note.

To be sure, the current market structure is best described as a battleground between bulls (bulls) and bears (bears), with a clear trend forming among long-term and short-term investors.

Glassnode.

Lack of consensus among analysts

The field of analysts in the bitcoin marketย is also in full battle of positions:ย there is no clear consensus on the direction the market will take from where it is currently

The financial analyst Rekt Capital, for example, pointed out this Thursday thatย bitcoin isย facing the appearance of a metric of bad omen, as its name suggests: the “cross of death.”

Stability after a bloody May

Although a recovery scenario is not fully supported, this first week of June has brought some calm to the bitcoin market, after a black May for the cryptocurrency.

The fall of the month of Mayย exceeded that of March 2020,ย when the declaration of the coronavirus pandemic shook not only bitcoin and the rest of cryptocurrencies, but also traditional markets and economies around the world.ย With a drop of more than 35%, this May 2021 isย one of the most negative months inย the history of bitcoin.

In the middle of the negative month,ย tradersย significantly increased their activity on exchanges.ย Exchange platforms experiencedย a record monthย , with $ 2.31 trillion in transaction volume during the month of May.

Taproot approval progresses

The activation of one of the main and most anticipated technological improvements for Bitcoin is getting closer and closer.ย With the arrival of a new cycle of Bitcoin mining difficulty,ย most miner poolsย have been signalingย in favor of activating Taproot.

With Taproot, the way Bitcoin transactions are transmitted would be updated which points to better privacy and efficiency.ย The proposal, which has wide support in the bitcoiner community, would be activated in November of this year.

This same week, Marathon’s MaraPool mining pool, one of the most representative companies in this industry in North America,ย stated that it was in favorย of this improvement.ย In addition, he announced that they would stop censoring Bitcoin transactions, a measure that they had taken shortly before in compliance with OFAC provisions.

Continuing in the realm of Bitcoin mining, this weekย the difficultyย of mining blocksย was reducedย by 16%,ย after a significantย dropย in accumulated processing power in previous days.

G7 Countries Adopt Historic Decision on Minimum Corporate Tax of 15%

0

Representatives of the G7 countries last weekend reached a landmark agreement on taxation. The goal is to deny multinational corporations the opportunity to go to tax havens and force them to pay taxes in the countries in which they operate.

The G7 countries, represented by finance ministers, have agreed to support a minimum global corporate tax rate of 15%.

The ministerial meeting in London marks the first face-to-face meeting since the outbreak of the pandemic. On the US side, the issue was overseen by Janet Yellen, the former head of the Fed and the current head of the Treasury.

โ€œThe G7 finance ministers have reached a historic agreement to reform the global tax system to match the digital age,โ€ said British Treasury Secretary Rishi Sunak, who is chairing the meeting.

European countries have already introduced digital taxes to combat tax evasion in the region by giants such as Google and Facebook. In light of the new deal, Yellen said European countries would drop existing taxes on digital services, which she said discriminated against American companies. She also noted that G7 finance ministers have made an “important, unprecedented commitment” to close a deal that will end the race to cut corporate taxes.

The introduction of a minimum tax has been discussed in developed countries for more than one year. The trends were followed by global giants, for whom the current decision is no longer a surprise.

Now the question of the minimum tax will be raised at the G20.

The G7 includes the US, Germany, UK, Japan, France, Italy and Canada.

Binance (BNB) coin prediction: Is it still worth to buy 2021

0

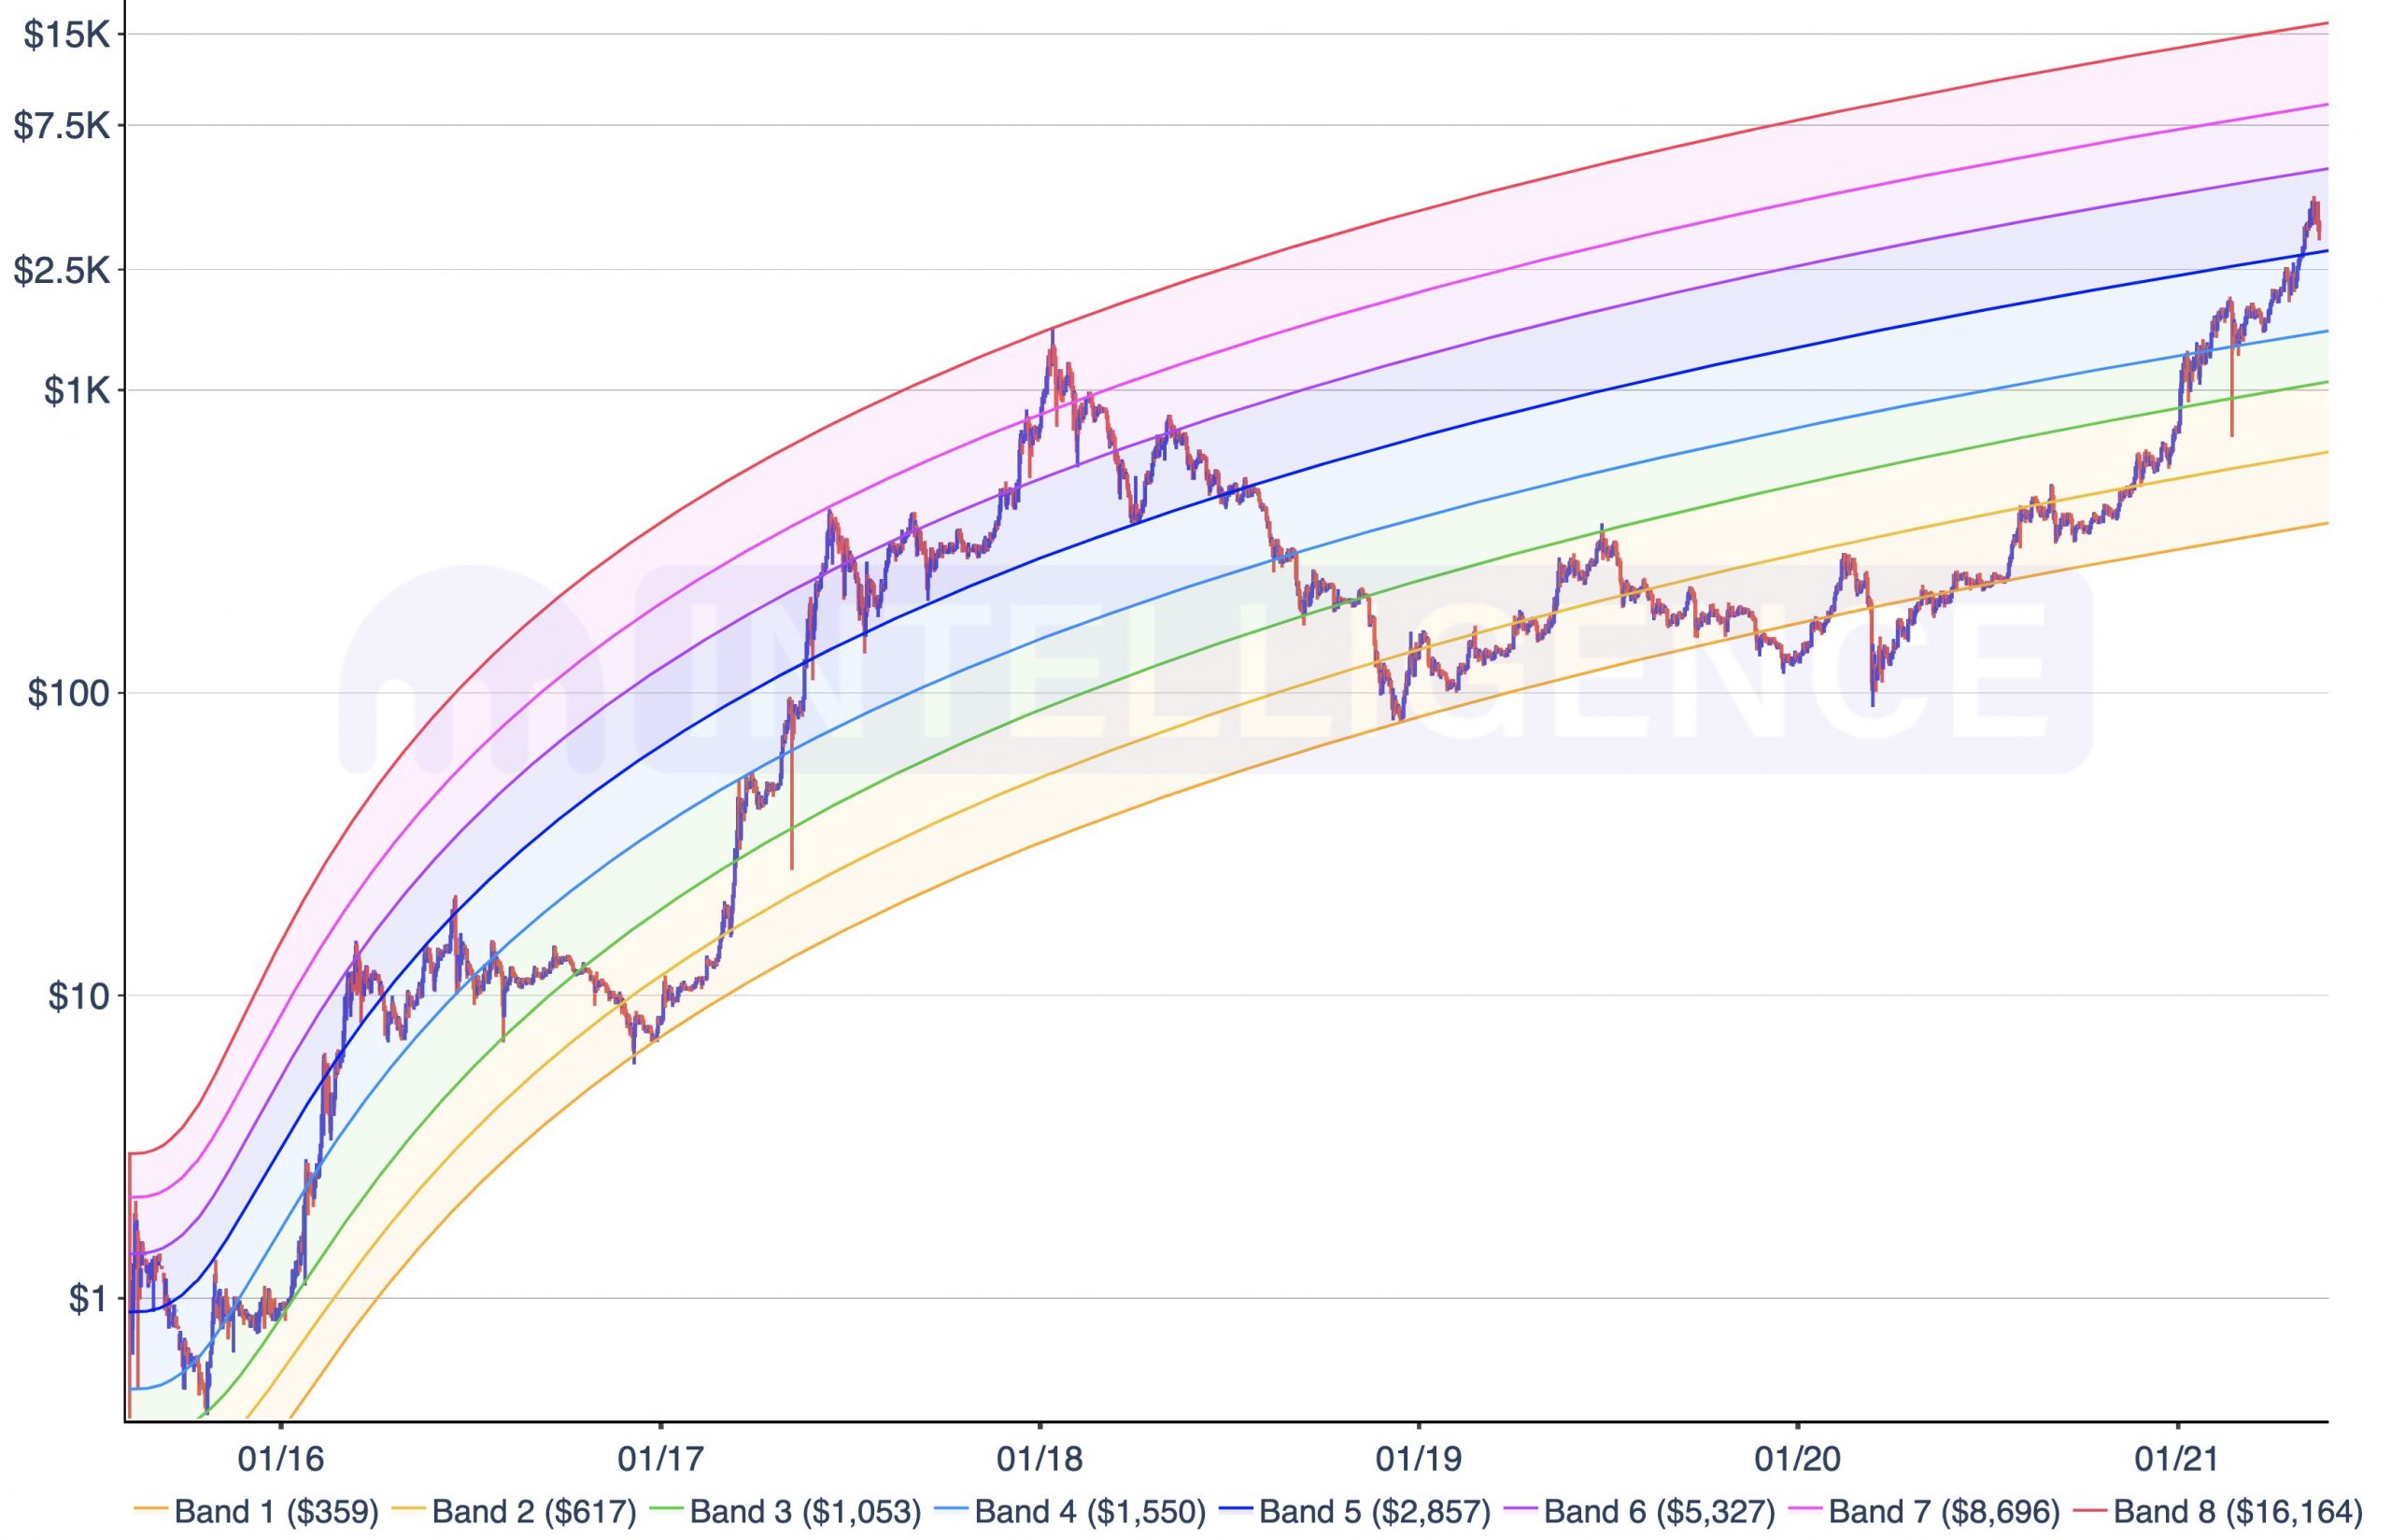
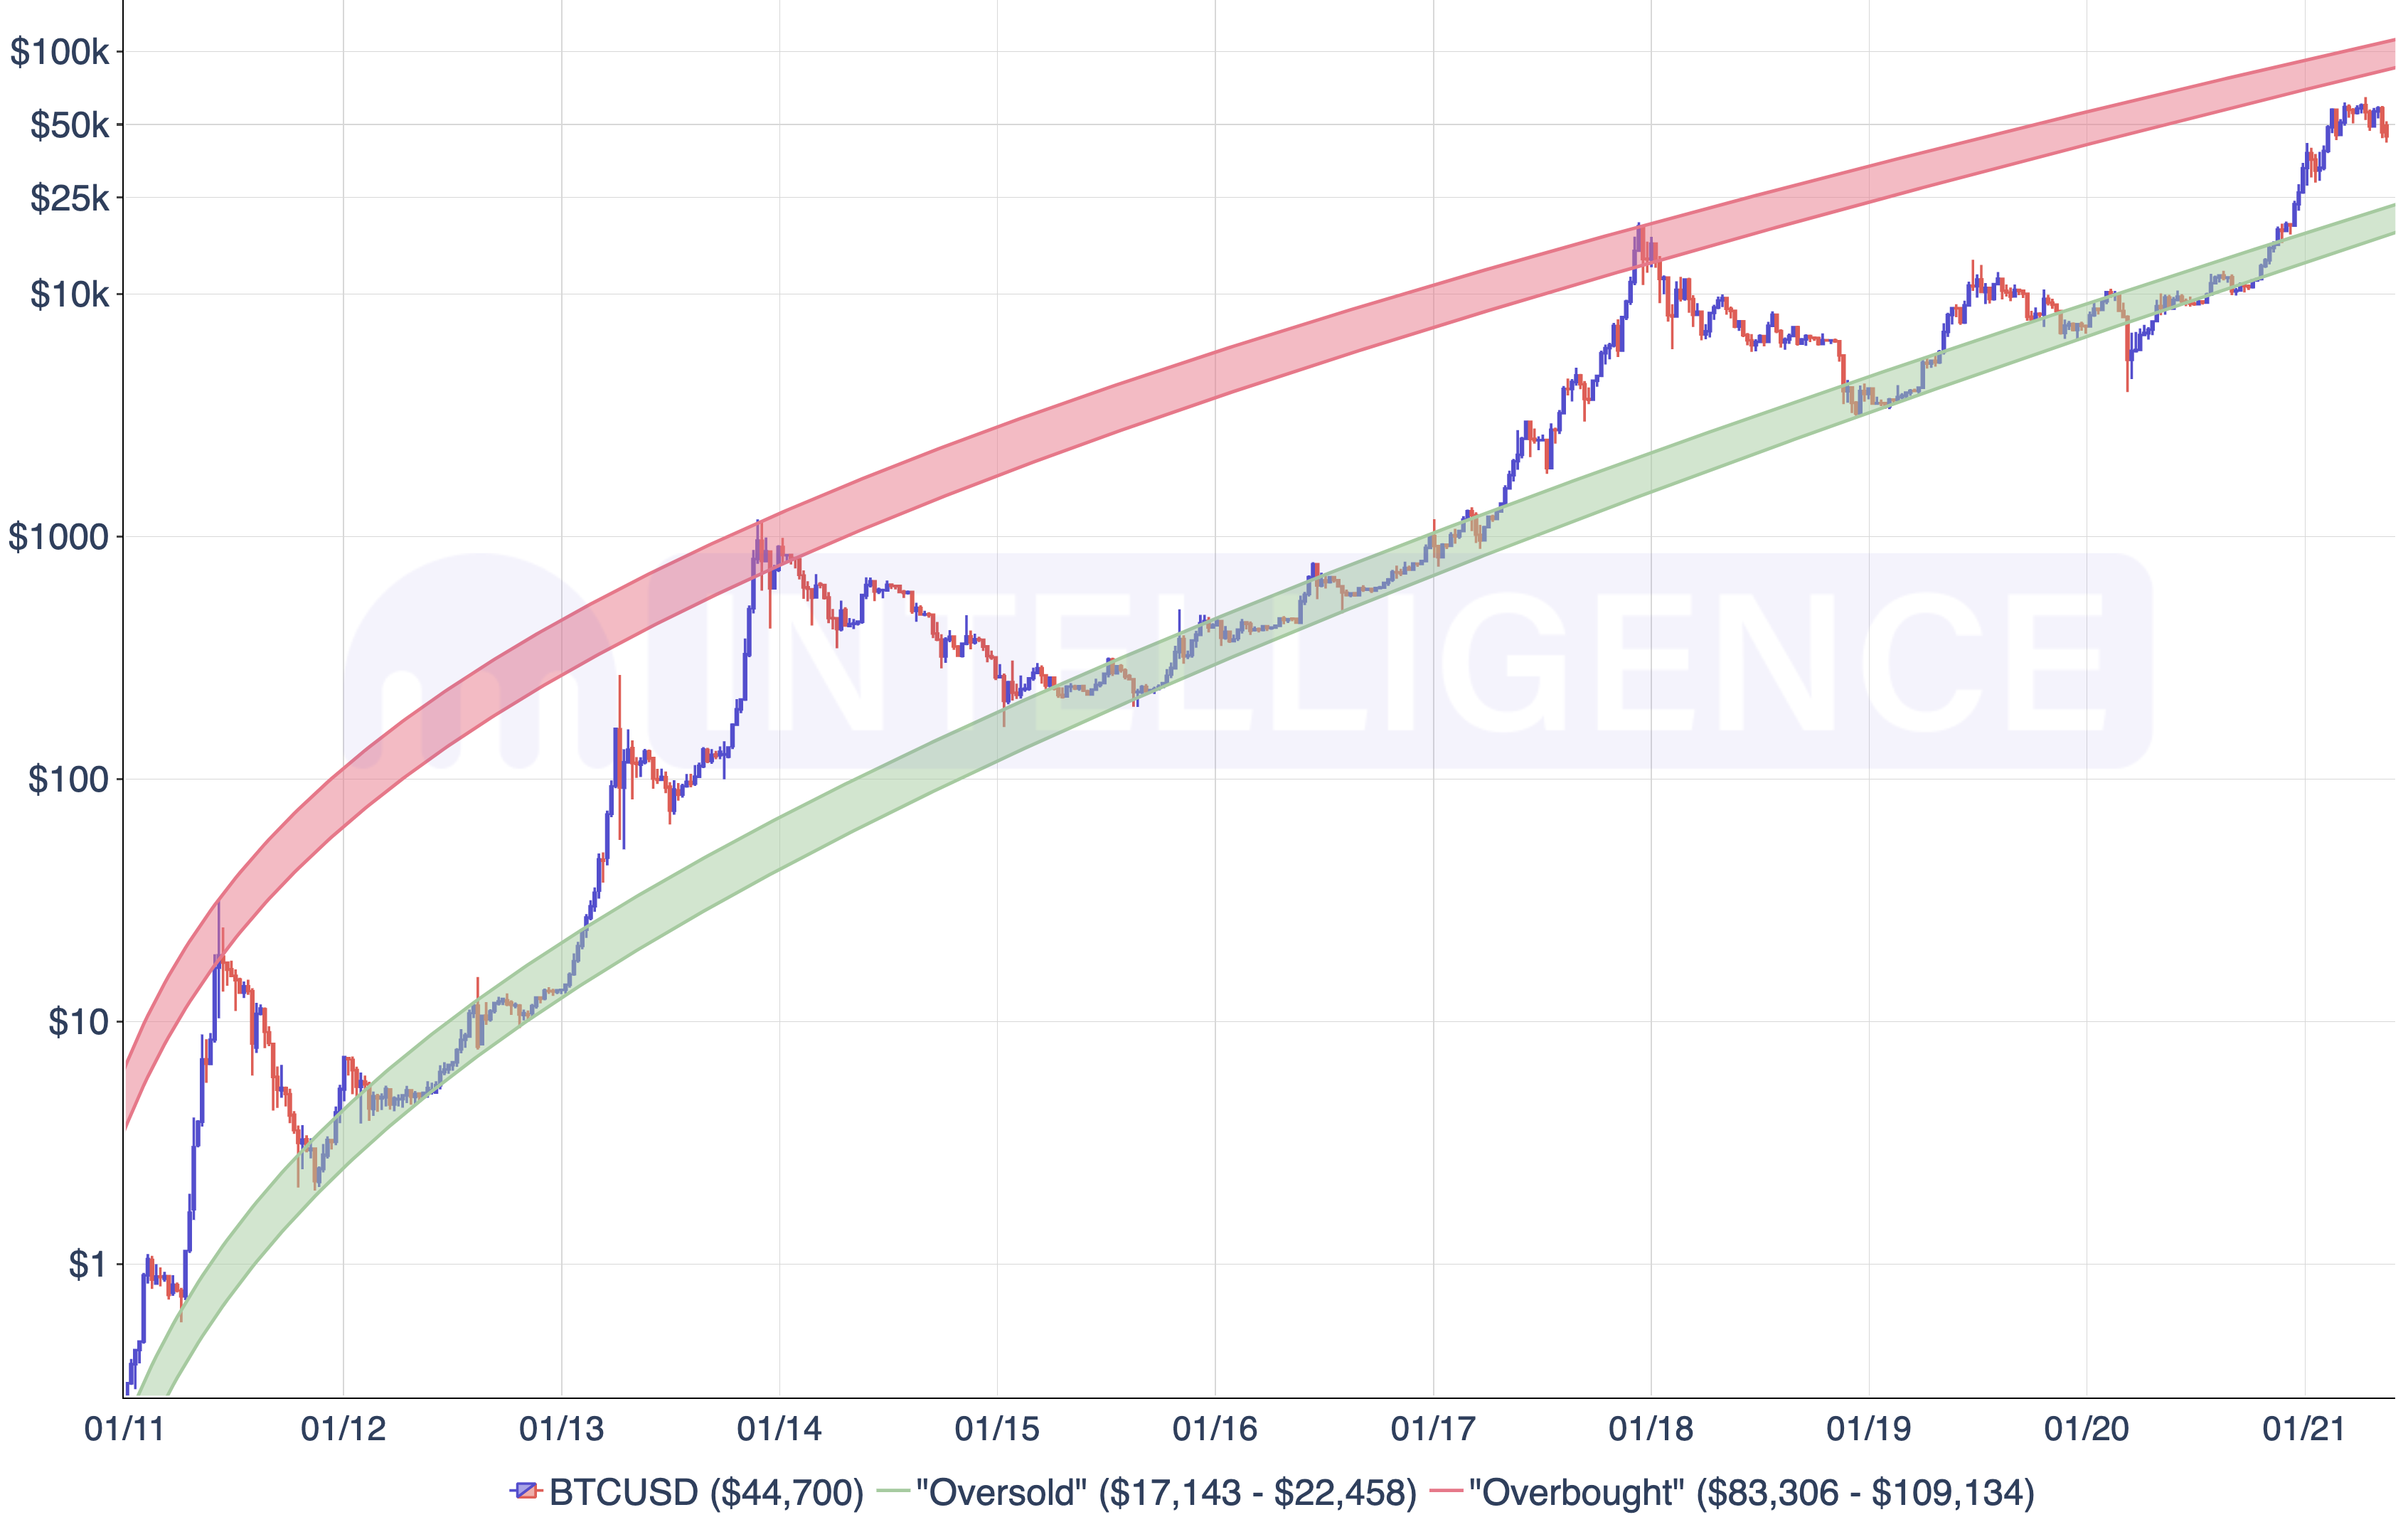
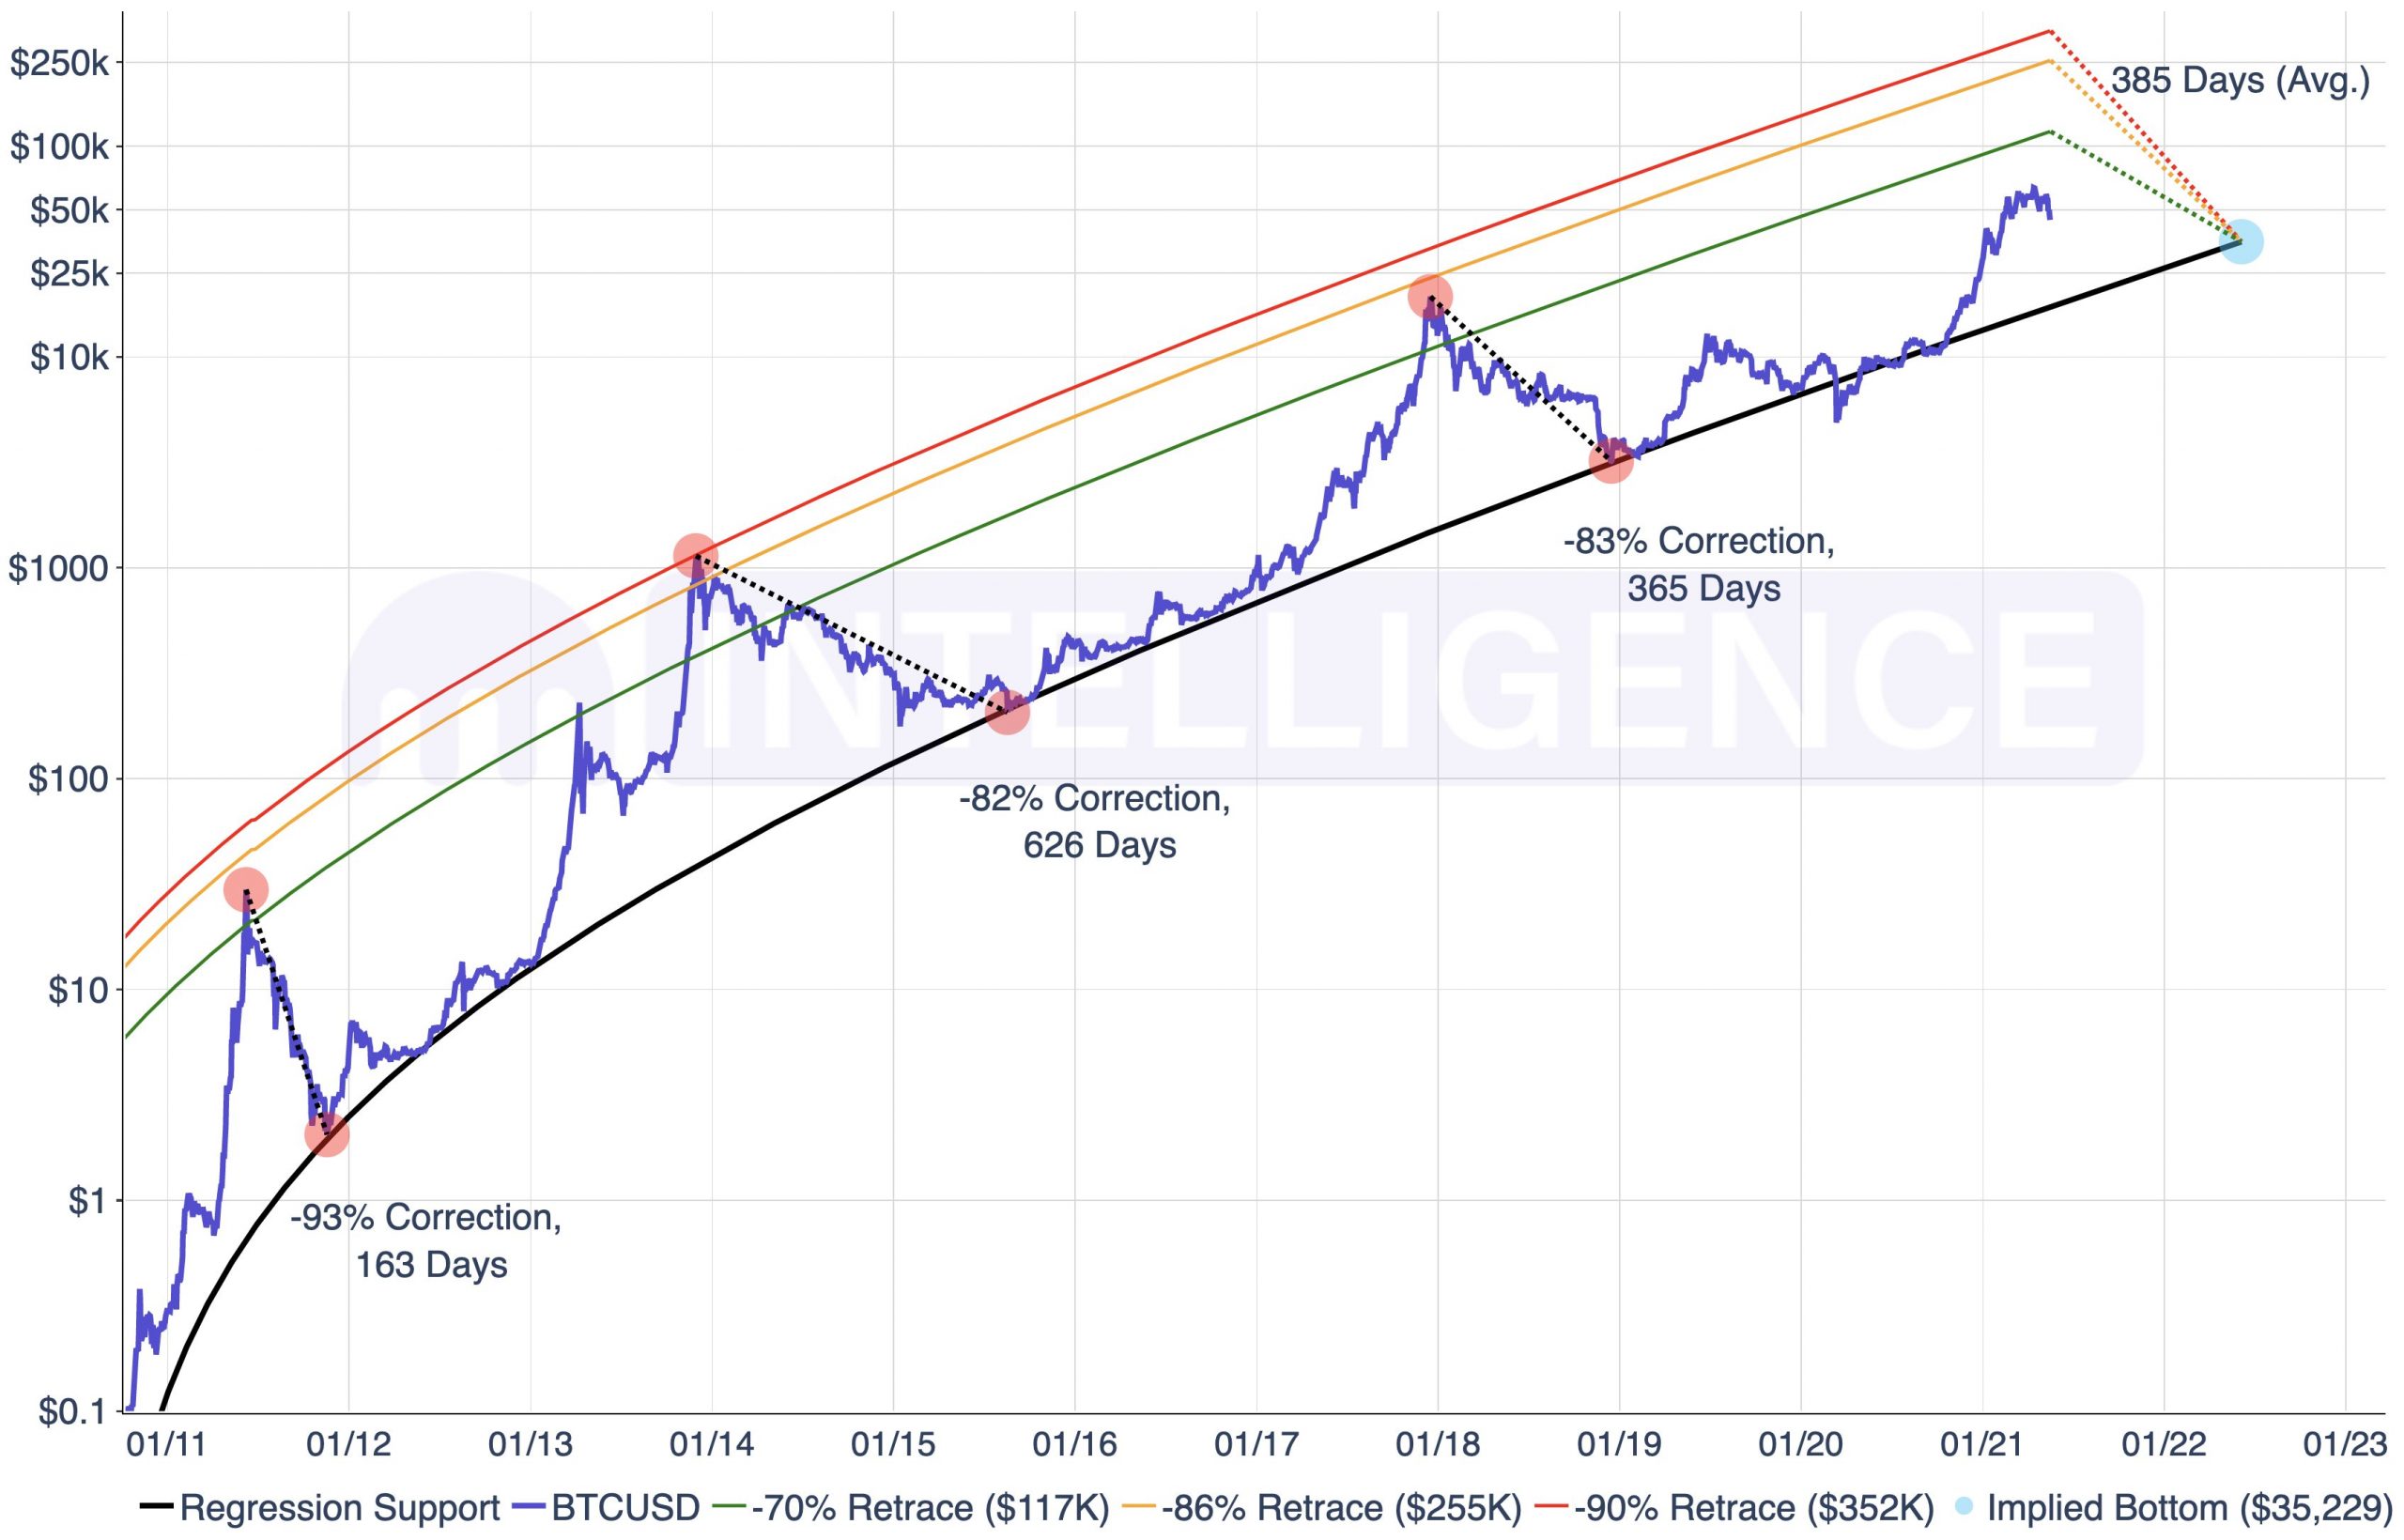
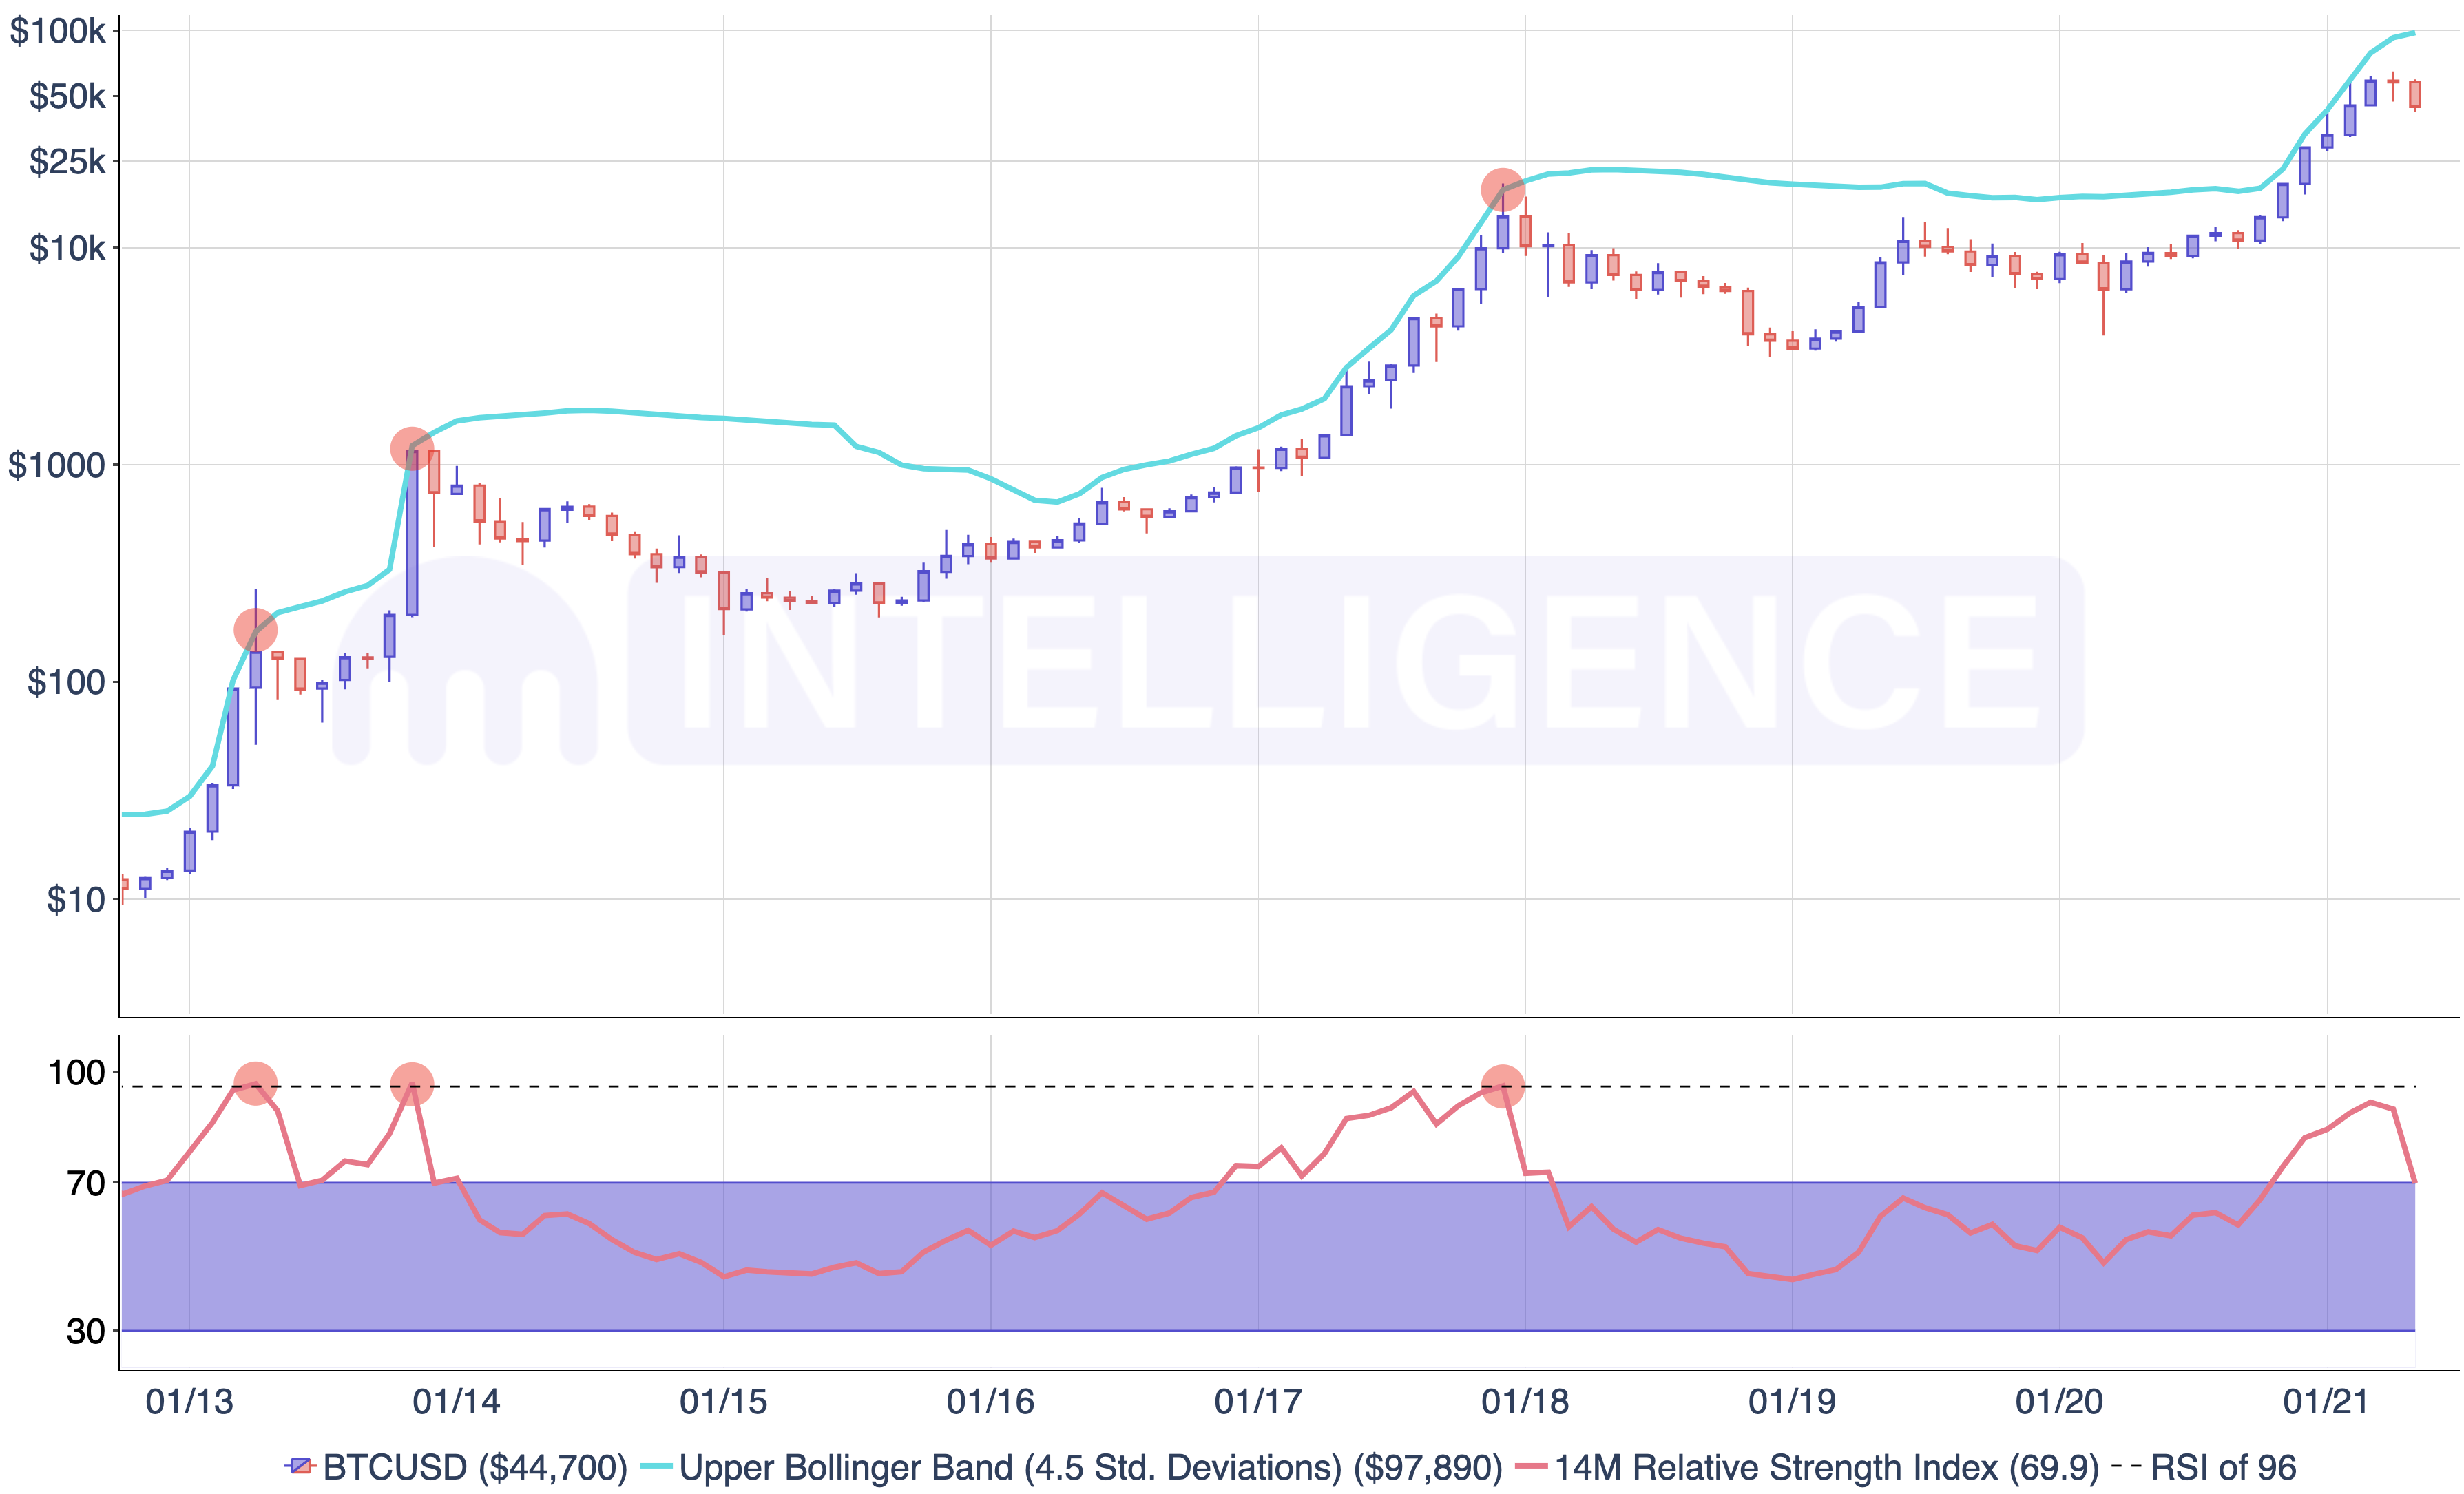
The history of the BNB cryptocurrency began rather modestly in the summer of 2017.ย The entire volume of coins was mined even before the ICO: the initial price was $ 0.10 per coin.ย Even during the crypto winter of 2018 in the altcoin markets, the coin has demonstrated resilience in the face of turbulence.ย At the moment, this coin is of keen interest among bidders.

After the sharp rise in the Binance Coin rate, the demand for BNB forecasts has also increased sharply.ย During 2020, the cryptocurrency more than doubled its value, growing by 146% – from $ 15 to $ 37 by the end of the year.ย However, the real extravaganza happened in 2021 when the bull market began.ย Within nine weeks, the BNB rate soared 824% and peaked at $ 342.

Binance Coin: Forecast for 2021

First, you need to remember how the Binance Coin cryptocurrency came into being.ย The coin was launched by the eponymous crypto exchange as a pillar of the ecosystem.ย One of the most important advantages of the new coin is the ability to use it to reduce fees onย the Binance exchangeย .ย In addition, BNB is part of the Binance blockchain, which competes withย Ethereumย by offering higher levels of scalability at the same time as lower transaction fees.

As you’d expect, one of the most ardent supporters of BNB and the network it supports is Changpeng Zhao, CEO of Binance.ย In a recent tweet, he stated:

Binance Smart Chain is not a replacement for the Ethereum network, but is trying to overtake it.ย Lower fees allow more transactions, allowing for a more inclusive DeFi ecosystem.

While Changpeng is not making a prediction for Binance Coin, his enthusiasm for BNB’s prospects is clear.ย He is actively reposting tweets that describe the advantages of altcoin overย ETHย , the second largest cryptocurrency in the world.ย The idea that the rising Binance Coin rate will help this currency to take the lead looks rather far-fetched, but altcoin supporters are confident that this digital asset has huge growth potential.

In a recent tweet, Changpeng emphasized that in 2017 people were not inclined to invest because the level of risk was too high, and in 2018 because the market crashed.ย In 2019 and 2020ย there was an intrigue as to whether the Binance Coin rate would be able to gain momentum, but in 2021, statements began to appear that the moment had already been lost.ย As Changpeng states:

The $ 500 invested in BNB in โ€‹โ€‹mid-2017 could make you a millionaire today.

If you look at the forecast for the Binance Coin cryptocurrency for 2021, analysts agree that the Binance Coin cryptocurrency is especially interesting to buy at the time of the fall.ย But do not forget that the market can be unpredictable, and what happened in the past will not necessarily repeat itself in the future.

BINANCE COIN (BNB) FORECAST FOR TODAY, TOMORROW, WEEK, MONTH, 2021 AND 2022

BNB is the currency from the Binance crypto exchange . It was created to keep the exchange running. Initially, most of the money from the sale of binance coins went to the development of the platform. The coin has long been firmly entrenched in the TOP 10 and is one of the most promising for investment. Below we will consider the forecast for the BNB rate for the near future and the long term.

BINANCE COIN PRICE PREDICTION FOR TODAY

June 7, 2021, Monday, the cost of 1 Binance Coin will be $ 394.67.

Trading Range : High Price: $ 395.38, Low Price: $ 393.96.

Change over the last 24 hours : + 0.08%.

To make money on cryptocurrency, buy coins at the lowest price and sell when the rate reaches its maximum.

BINANCE COIN PRICE PREDICTION FOR TOMORROW
Tomorrow, June 8, 2021, the Binance Coin price will be $ 394.41.

Trading Range: High Price: $ 397.47, Low Price: $ 391.35.

BINANCE COIN PRICE PREDICTION FOR THE WEEK AND MONTH

We suggest that you familiarize yourself with a detailed forecast of the value of Binance Coin against the US dollar for the week and month ahead.

FOR A WEEK
Course June 7, 2021 Monday : average price – $ 394.67, maximum – $ 395.38, minimum – $ 393.96.

Course June 8, 2021 Tuesday : the average price is $ 394.41, the maximum is $ 397.47, the minimum is $ 391.35.

Exchange rate June 9, 2021 Wednesday : the average price is $ 393.42, the maximum is $ 394.49, the minimum is $ 392.36.

Course June 10, 2021 Thursday : the average price is $ 392.77, the maximum is $ 396.41, the minimum is $ 389.13.

Exchange rate June 11, 2021 Friday : the average price is $ 390.89, the maximum is $ 392.22, the minimum is $ 389.55.

Exchange rate June 12, 2021 Saturday : average price – $ 393.10, maximum – $ 393.62, minimum – $ 392.57.

Exchange rate June 13, 2021 Sunday : average price – $ 394.04, maximum – $ 396.56, minimum – $ 391.52.

FOR 2 WEEK
Course June 14, 2021 Monday : average price – $ 393.67, maximum – $ 395.85, minimum – $ 391.48.

Course June 15, 2021 Tuesday : average price – $ 395.87, maximum – $ 397.72, minimum – $ 394.02.

Course June 16, 2021 Wednesday : average price – $ 395.77, maximum – $ 399.16, minimum – $ 392.39.

Course June 17, 2021 Thursday : average price – $ 395.71, maximum – $ 397.75, minimum – $ 393.67.

Course June 18, 2021 Friday : average price – $ 394.60, maximum – $ 396.38, minimum – $ 392.82.

Course June 19, 2021 Saturday : average price – $ 392.63, maximum – $ 392.63, minimum – $ 392.63.

Course June 20, 2021 Sunday : average price – $ 392.71, maximum – $ 392.83, minimum – $ 392.59.

3 WEEKS
Course June 21, 2021 Monday : average price – $ 390.24, maximum – $ 390.94, minimum – $ 389.53.

Course June 22, 2021 Tuesday : average price – $ 387.82, maximum – $ 388.87, minimum – $ 386.76.

Exchange rate June 23, 2021 Wednesday : the average price is $ 388.49, the maximum is $ 392.78, the minimum is $ 384.21.

Course June 24, 2021 Thursday : the average price is $ 387.02, the maximum is $ 388.22, the minimum is $ 385.81.

Rate June 25, 2021 Friday : average price – $ 386.63, maximum – $ 387.29, minimum – $ 385.97.

Exchange rate June 26, 2021 Saturday : average price – $ 387.04, maximum – $ 389.92, minimum – $ 384.16.

Course on June 27, 2021 Sunday : average price – $ 387.10, maximum – $ 387.89, minimum – $ 386.30.

4 WEEKS
Course June 28, 2021 Monday : average price – $ 388.95, maximum – $ 391.24, minimum – $ 386.67.

Course June 29, 2021 Tuesday : average price – $ 389.34, maximum – $ 391.91, minimum – $ 386.78.

Exchange rate June 30, 2021 Wednesday : average price – $ 388.14, maximum – $ 388.76, minimum – $ 387.51.

Course July 1, 2021 Thursday : the average price is $ 390.04, the maximum is $ 392.13, the minimum is $ 387.94.

Course July 2, 2021 Friday : average price – $ 389.88, maximum – $ 390.00, minimum – $ 389.76.

Course July 3, 2021 Saturday : average price – $ 393.47, maximum – $ 394.44, minimum – $ 392.49.

Course July 4, 2021 Sunday : average price – $ 389.67, maximum – $ 389.73, minimum – $ 389.61.

5 WEEKS
Course July 5, 2021 Monday : average price – $ 391.46, maximum – $ 391.78, minimum – $ 391.15.

Course July 6, 2021 Tuesday : average price – $ 391.62, maximum – $ 393.93, minimum – $ 389.31.

Bitcoin, Ethereum Price Technical and Fundamental Analysis | Updated May 2021

0
Bitcoin, Ethereum Price Technical and Fundamental Analysis Updated May 2021

Here are some charts worth keeping an eye on as we navigate the bull market cycle.

Here are someย charts worth keeping an eye on as we navigate yet another excitingย bull market cycle.

This week’s updates include:

  • BTC’sย 200-Week Moving Averageย has fallen to a 3-month low ofย 3.54x, well below the historical 10x – 15x multiple we’ve seen in prior bull market cycles.

  • BTC posted aย weekly close belowย theย Bull Market Weekly Supportย on Sunday, May 16 for the first time sinceย April 2020. In 2013 and 2017, BTC momentarily traded below said support before ultimately resuming its macro uptrend.

  • BTC’sย 14-Month RSIย is currently 69.9 and back in “neutral” territory forย the first time since October 2020. This reversion lower suggests BTC is trending in a manner akin to theย 2013 bull market.

  • BTC’sย MVRV Z-scoreย of 2.94 is down -28% from last week’s reading of 4.09 and sitsย at a 5-month low. BTC was trading at $19,400 the last time its z-score was this low.

  • BTC’sย SOPR Indicatorย has fallen to a reading of 1.0126, a level last seen in September 2020. With the SOPR indicator fast approaching a reading of 1, one could expect BTC to bounce higher in the days/weeks ahead.

Ethereum’s Logarithmic Regression Rainbow

How To Read This Chart:

  • Using ETHโ€™s historical price action, we can plot logarithmic regression trendlines that coincide with historical levels of support and resistance.

  • These lines can be useful for navigating bull and bear market cycles, as well as for identifying critical levels of support and resistance.

  • Do note that with each day that passes, ETH’s logarithmic regression rainbow trends higher. This means the longer ETH can continue to trend higher to the next subsequent regression trendline, potentially the higher the market cycle top.

What You Should Know:

  • At a current price of $3,392, ETH currently resides between Band 5 ($2,857) and Band 6 ($5,327).

  • Based on these regression lines, ETH’s next big test of resistance is currently at $5,327 while support resides around $2,857.

  • ETH would have to rally +57% to test resistance at $5,327 and would have to correct -16% to test support at $2,857.

  • A move up to Band 8, which coincides with ETHโ€™s previous market cycle top, would imply a $16,164ย Ether and a +313.0% return from current price.

Bitcoin’s +1 Yr. HODL Wave

How To Read This Chart:

  • BTC’s +1 Yr. HODL Wave shows what percentage of coins in circulation haven’t been moved in at least 1 year.

  • When charted against BTC’s price, one can identify trends that coincide with bull and bear market cycles.

  • Historically, a local top in the +1 Yr. HODL wave is congruent with the start of a new bull market. When the number of untouched coins begins to decline amid rapid price appreciation, one can be confident that a new bull market cycle is likely underway.

  • When the downward slope of the HODL wave grows increasingly steeper, one can assumeย that selling pressure is beginning to increase and supply is likely to outpace demand. As such, a cycle top is presumably creeping closer.

  • Prior to hitting a local high, a gradual increase in the +1 Yr. HODL wave signals that market participants are in “accumulationย mode.”

What You Should Know:

  • BTC’s current +1 Yr. HODL Wave reading sits at 54.67%, i.e. 54.67% of all coins in circulation haven’t been moved in more than a year. This is down -8.7 percentage points from a local top of 63.4% set on September 9, 2020.

  • On January 31, 2013, BTC’s +1 Yr. HODL Wave hit a local high of 48.2% and the price of BTC was at $20.40. When BTC hit a cycle high of $1,158 on November 30, 2013, the +1 Yr.ย HODL Wave reading was at 38.8%. That is, over the course of 303 days, the number of coins that hadn’t been moved in more than a yearย had fallen 9.4 percentage points while priceย appreciated +5,580%.

  • On January 19, 2016, BTC’s +1 Yr. HODL Wave hit a local high of 61.5% and the price of BTC was at $380. When BTC hit a cycle high of $19,660 on December 17, 2017, the HODL Wave reading was at 43.1%. That is, over the course of 698 days, BTC’s HODL Wave fell -18.4ย percentage points while price appreciated +5,073%.

Bitcoin’s 200W Moving Avg. Multiple

How To Read This Chart:

  • 200W Moving Average:ย A critical level of support used toย determine an overall long-term market trend. The trendline measures the average price of BTC over the priorย 200 weeks.

  • Moving Average Multiple:ย Theย multiple with which BTC is trading at relative to its 200-weekย moving average. For example, a multiple of 4.0x means BTC is trading at 4x its 200-week moving average.

What You Should Know:

  • In prior bull market cycles, BTC has traded as much as 10x –ย 15x its 200-week moving average prior to entering a bear market.

  • BTC’s 200-week moving average is 3.54x. That is, BTC is trading at 3.54x its 200-week moving average ($12,630),ย down from last week’s multiple of 3.74x and representing a 3-month low.

  • Given today’s 200-week moving average of $12,630, a 10x –ย 15x multiple would imply a BTC price of $126,300 – $189,450.

  • BTC’s 200-week moving average multiple hit a local high of 10.3X for the week of April 4,ย 2013. On April 9, 2013, BTC hit a cycle high of $259.

  • BTC’s 200-week moving average multiple hit a local high of 13.2X for the week of November 25,ย 2013, which coincidedย with a market cycleย top of $1,158.

  • BTC’s 200-week moving average multiple hit a local high of 15.2X for the week of December 11, 2017. That same week, price hit a cycle high of $19,660.

Bitcoin’s Bull Market Weekly Support

How To Read This Chart:

  • BTC’s Bull Market Weekly Support tracks two critical levels of support that have acted as last lines of defense in prior bull market cycles: BTC’s 20-week exponential moving averageย and 21-week simpleย moving average.

  • In prior bull market cycles, BTC has mean reverted down to the 20W EMA and 21W SMA before bouncing and resuming its uptrend.

  • When BTC breaks below both moving averages, the likelihood of BTC’sย bull market coming to an end is heightened.

What You Should Know:

  • At a price of $44,700, BTC’s 20-week exponential moving average is $46,823 and its 21-week simple moving average is $48,370.

  • BTC posted a weekly close belowย the bull market weekly support on Sunday, May 16 for the first time since March 2020. Although bearish, we’ve seen several instances in the past where BTC momentarily traded below the weekly support band before resuming its macro uptrend.

  • A move back up to BTC’s 20-week exponential moving average equates to a +4.8% gain from current price.

  • A return back above BTC’s 21-week simple moving average equates to a +8.2% rally from current levels.

Bitcoin’sย Logarithmic Growth Curve

How To Read This Chart:

  • BTC’s logarithmic growth curve consists of two sets of curved trendlines that have historically proven to be critical levels of support and resistance.

  • While both lines point to price ranges whereby BTC is arguably “overbought” or “oversold,” they also represent a notable underlying property of BTC that can be found in social networks, technological innovations, pandemics, societies, and economics: exponential growth.

What You Should Know:

  • BTC is a +86% to +144% move away from entering into “overbought” territory, which is currently between $83,306 and $109,134.

  • BTC is a -50% to -62% move away from falling into “oversold” territory. This week’s range is $17,143 – $22,458.

  • At a current price of $44,700, BTC resides in the 49 percentile of the logarithmic growth curve’s $17,143 – $109,134 range.

Kraken Intelligence’s Bitcoin Logarithmic Retracement Curve

How To Read This Chart:

  • BTC’s logarithmic retracement curve uses the growth curve’s uptrending support line and historical price action to back into an implied market cycle top.

  • Since 2011, BTC has long respected the growth curve’s support line and has historically retraced down to said level upon hitting a market cycle top.

  • When considering BTC’s previous bull market cycles, one will find that it takes, on average, 385 days for BTC to retrace back down to the support band after hitting aย top.

  • Also, one will find that BTC has corrected, on average, -86% after the bull market ends.

  • By knowing where the price of the support curve is 385 days from today and making assumptions about how severe BTC will correct after hitting a cycle top, one can have a better sense as to whereย BTCย would need to be tradingย to correct down to the support band over a period of 385 days.

What You Should Know:

  • The price of BTC’s logarithmic growth curve support 385 days from today is $35,229.

  • Assuming BTC corrects -70% this market cycle, BTC would need to be trading at $117K for BTC to retrace down to support 385 days from today.

  • An -86% correction implies aย $255K cycle top and a -90% correction implies aย $352K cycle top.

  • According to this model, BTC is not currently in “market cycle top” territory.

Bitcoin’s Monthly Upper Bollinger Band & RSI

How To Read This Chart:

  • Bollinger Bands:ย A technical indicator that can be used to measure volatility and identify โ€œoverboughtโ€ or โ€œoversoldโ€ conditions. When trading above the upper band, anย asset can be considered “overbought.” If trading below, the asset is considered “oversold.” Oftentimes, the upper and lower Bollinger band represents a +/- 2 standard deviation move from a 20-period moving average. However, we’ll be keeping an eye on a +4.5 standard deviation upper Bollinger band relative to BTC’s 20-month moving average.

  • Relative Strength Index (RSI):ย One of most popular and widely used momentum oscillators. It measures over a 14-period duration and fluctuates between 0ย and 100. A reading below 30 indicates “oversold,” a reading over 70 signals “overbought.” Given its historical relevance, we’ll be focusing on BTC’s 14-month RSI.

What You Should Know:

  • BTC’s current intramonth high of $59,603 came $38,286ย short of crossing its monthly upper Bollinger band of $97,889.

  • BTC’s 14-month RSI is currently 69.9 and is in “neutral” territory for the first time since October 2020. The trend in BTC’s monthly RSI appears to beย akin to 2013 when the index entered into “overbought” territory, then “neutral” territory, and then back into “overbought” territory upon BTC’s second parabolic uptrend of 2013.

  • In Aprilย 2013, Novemberย 2013, and December 2017, BTC hit an intramonth high above itsย monthly upper Bollinger band as price setย a market cycle top. Only in theseย 3 instances have we seen BTC breakย through its +4.5 standard deviation monthly upper Bollinger band.ย BTC’s 14-month RSI also topped out well into “overbought” territory at a reading of 96.

Bitcoin’s MVRV Z-Score

How To Read This Chart:

  • What Is A Z-Score?ย Aย numerical measurement that can explain a value’s relationship to a group’sย average. It is measured in terms of standard deviations. For example, a z-score of 0 means that a value is identical to theย mean and a z-score of 1.0 means that aย value is one standard deviation above the average.

  • BTC’sย MVRV Z-Score:ย Considers BTC’s market value and realized value to help determine when BTC may be over/undervalued. A z-score between 7 and 11 (pink box) suggests BTC is “overbought.” When between 0.9 and -0.3 (green box), BTC is believed to be “oversold.”

  • MVRV Z-Score Formula:ย (Market Value โ€“ Realized Value) / (Std. Deviation of Market Value).

  • Market Value:ย BTC’s price multiplied by coins in circulation, i.e. market cap.

  • Realized Value:ย The price of each BTC when it was last moved.

What You Should Know:

  • BTC’s current MVRV z-score is 2.94, down -1.7% from yesterday’s reading of 2.99, down -28.1% from last week’s reading of 4.09, and nowย at a 5-month low. The last time BTC’s MVRV z-score was this low, BTC was trading at $19,400.

  • BTC’s market value is down -2.3% at $893Bย and its realized value is unchanged atย $377B.

  • A +138.1% increase in BTC’s z-score would put the indicator in “overbought” territory. A -69.4% correction would put the indicator in “oversold” territory.

  • Prior z-score tops:

    • April 9, 2013: 11.05

    • November 23, 2013: 10.8

    • December 8, 2017: 9.77

    • Average score: 10.54

    • Note: These z-score readings topped out 1 day, 7 days, and 11 days, respectively, ahead of a market cycle top.

  • On February 21, 2021, BTC’s z-score hit a 3-year high of 7.62.

Bitcoin’s Stock-to-Flow Ratio

How To Read This Chart:

  • Much like gold and silver, we can considerย BTC’s circulating supply (stock) against itsย expected production of new supply (flow) to get a stock-to-flow ratio.

  • Aย highย stock-to-flow ratio implies that a commodity is growing increasingly scarce and more valuable as a result.

  • By overlaying BTC’s price against its stock-to-flow ratio, one will find that BTC’s price has trended alongside the ratio over the years.

  • One will also find thatย BTC’s price continues to divergeย less and less from its stock-to-flow ratio, which is a 365-day average; when price trends above the stock-to-flow ratio, the divergence is positive (>1) and thus BTC may be considered “overbought.”

  • The multi-coloredย line denotes the number of days until Bitcoin’s next halving, which is when the mining reward for a new block is cut in half. This reduction in new coins (flow) drives BTC’s stock-to-flow ratio higher, implying that BTC is scarcer and thus more valuable.

What You Should Know:

  • Bitcoin is 1078 days out from its next halving, at which point its block reward will fall from 6.25 BTC to 3.125 BTC.

  • BTC’s current divergence is 0.46, down from yesterday’s reading of 0.47 and down from last week’s reading of 0.56.

  • Prior market cycle tops coincided with a divergence reading of 40.8 (June 2011), 9.8 (April 2013), 9.75 (December 2013), and 3.5 (December 2017).

Facebook now allows you to upload audio status messages: you need to know that!

0
Facebook now allows you to upload audio status messages: you need to know that!

With the advent of new platforms that use audio as their primary means of communication, Facebook is now planning to follow suit. So there should also be audio status messages in the future. But is that a good idea?

At the beginning of the 21st century,ย Facebookย was one of the pioneers that made the global social media triumphant advance possible. In the meantime, the social network has become indispensable and dominates the market as a big player. Nevertheless, more and more other platforms are increasingly attracting users and trying to shake Facebook’s throne. Users are more likely to migrate from Facebook. The young audience in particular seems to be more on TikTok and Instagram. In addition, networks are emerging that rely on audio as the primary means of communication. Itย goes withoutย saying that Mark Zuckerberg is also closely monitoring this development – and that is why he nowย wants to integrate sound on his sideย . Quite a few, however, are already questioning the future of the main actor in social media.ย 

Facebook will soon also be using audioย 

“We believe audio will be a world-class medium and there are a lot of products that can be built across that spectrum,” Zuckerberg recently told journalist Casey Newton. What is interesting is that he made this statement aboutย Discordย – a new app entirely focused on audio chat, offering users rooms and conversations where anyone can communicate by recording audio messages. Similar to the drop-in audio platform Clubhouse. It was already known that Zuckerberg uses Discord in addition to the WhatsApp alternative Signal , but the fact that he gave his interview this way makes it clear: He comes to the party very late.

According to a report by Forbes, Zuckerberg’s company is investing in theย Audio Creator Fundย , which is similar to other platforms like TikTok and Snapchat. These platforms pay content creators by calculating how much is shared. The more views, the better. Of course, this primarily attracts influencers – and thus also attracts younger users to the platform. On the other hand, everyone is allowed toย upload audio recordingsย , which creates rooms similar to those on Discord or Clubhouse.ย 

Does Facebook Audio end up going as fast as it came?

However, given theย failure of Facebook’s video platformย , there are doubts as to whether the company will now be successful with this audio idea. Five years ago, developers started investing in video content and the Facebook Watch platform, even luring some brands away from YouTube. The problem is that the idea never caught on. It was even found that Facebook overestimated some publishers’ video metrics and altered their numbers to get more shared than it actually was – which ended up sparking some lawsuits.

The truth is that while Facebook Watch is used by the platform’s subscribers, the performance is minimal compared to YouTube. Even the short videos can’t compete with TikTok or Instagram Reels. So the bottom line is that Facebook has remained a text platform – and only remains relevant through text. This could be a problem, especially for influencers. A unique new platform that is focused on audio from the start and does not have to re-implement anything has it easier.ย 

It is not yet known when these new audio options will come on Facebook.ย But one thing is clear: every second is worth gold – and nobody knows that better than Mark Zuckerberg.